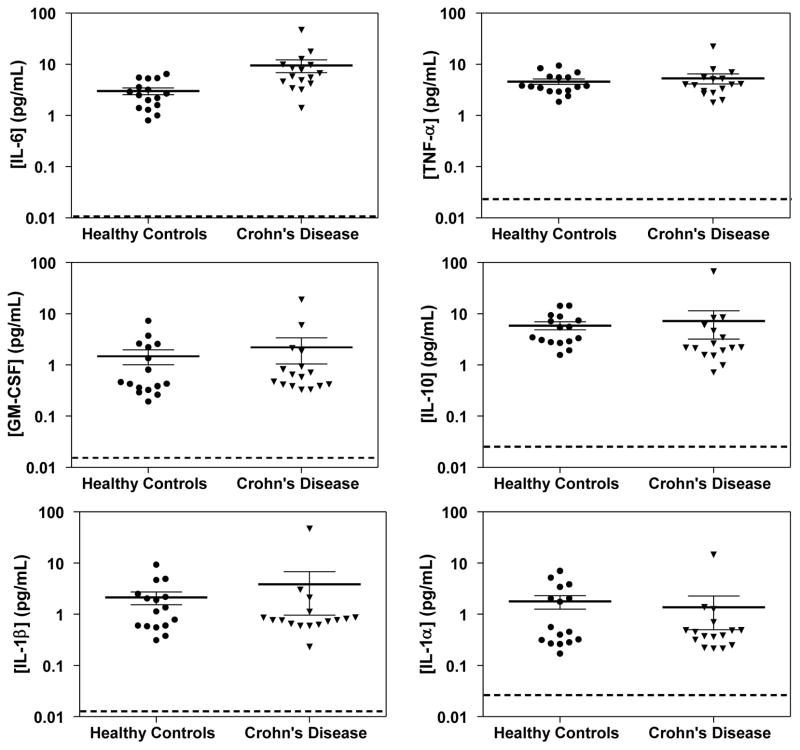
Figure 3.
Scatter plots of the concentrations determined using Simoa of 6 cytokines in the plasma of CD patients and matched healthy controls. The thick and thin solid lines are mean concentrations and standard error means (SEM) for that population. The dotted lines represent the average LOD of each cytokine in the 6-plex Simoa assay.

