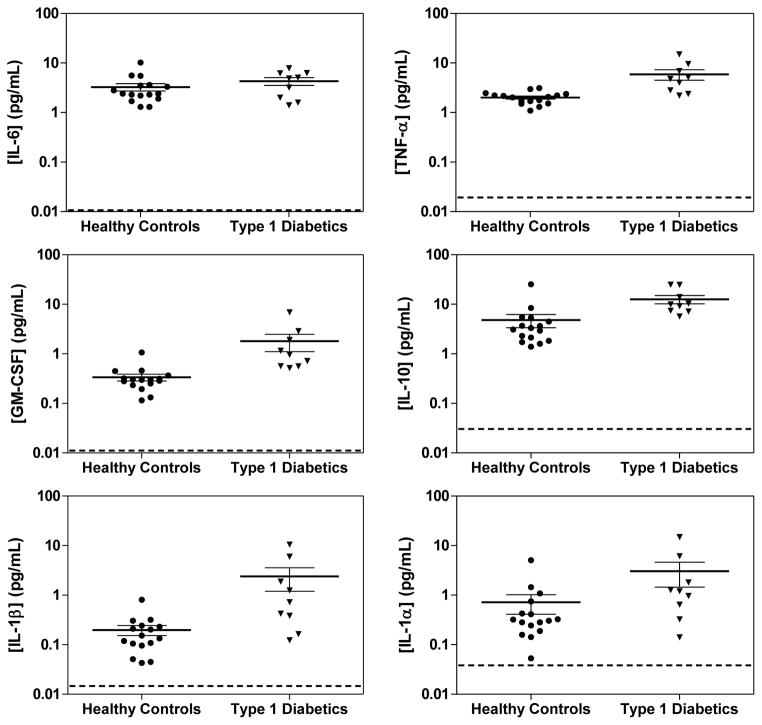
Figure 5.
Scatter plots of the concentrations determined using Simoa of 6 cytokines in the serum of patients with Type 1 diabetes and healthy controls. The thick and thin solid lines are mean concentrations and SEM for that population. The dotted lines represent the average LOD of each cytokine in the 6-plex Simoa assay.

