
TABLE 1.
Optimization of reaction conditions. a
|
| Entry | 1a (equiv) | 2a (equiv) | Base (equiv) | Yield b (3b/N1/3b′) (%) |
|---|---|---|---|---|
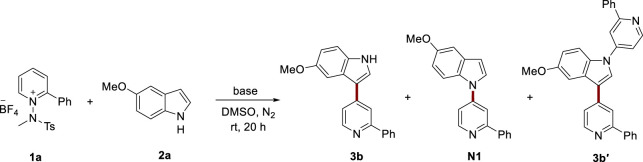
| 1 | 1.5 | 1.0 | Cs2CO3 (2.0) | trace/trace/trace |
| 2 | 1.5 | 1.0 | NaOtBu (2.0) | 48/17/9 |
| 3 | 1.5 | 1.0 | DBU (2.0) | 38/trace/trace |
| 4 | 1.5 | 1.0 | NaH (2.0) | 51/13/12 |
| 5 | 1.5 | 1.0 | KOtBu (2.0) | 26/9/5 |
| 6 | 1.5 | 1.0 | LiOtBu (2.0) | 48/3/7 |
| 7 | 1.0 | 1.0 | LiOtBu (1.2) | 46/6/4 |
| 8 | 1.0 | 1.0 | LiOtBu (1.5) | 49/5/4 |
| 9 | 1.0 | 1.0 | LiOtBu (1.8) | 55/5/5 |
| 10 | 1.0 | 1.0 | LiOtBu (2.0) | 57/5/4 |
| 11 | 1.0 | 1.0 | LiOtBu (2.5) | 55/4/4 |
| 12 | 1.0 | 1.5 | LiOtBu (2.0) | 73/8/trace |
| 13 | 1.0 | 2.0 | LiOtBu (2.0) | 82/8/trace |
| 14 c | 1.0 | 2.0 | LiOtBu (2.0) | 18/2/trace |
| 15 d | 1.0 | 2.0 | LiOtBu (2.0) | trace/trace/trace |
| 16 | 1.0 | 2.0 | no base | trace/trace/trace |
Entry 13 was selected as an optimal condition.
a
Reaction conditions: 1a or 2a was used as a limiting reagent (0.1 mmol for 1.0 equiv) in DMSO (1.0 mL) under N2 atmosphere at rt for 20 h.
b
NMR, yields were measured with the caffeine as an internal standard.
c
DMF, was used instead of DMSO.
d
THF, was used instead of DMSO.