
FIGURE 1.
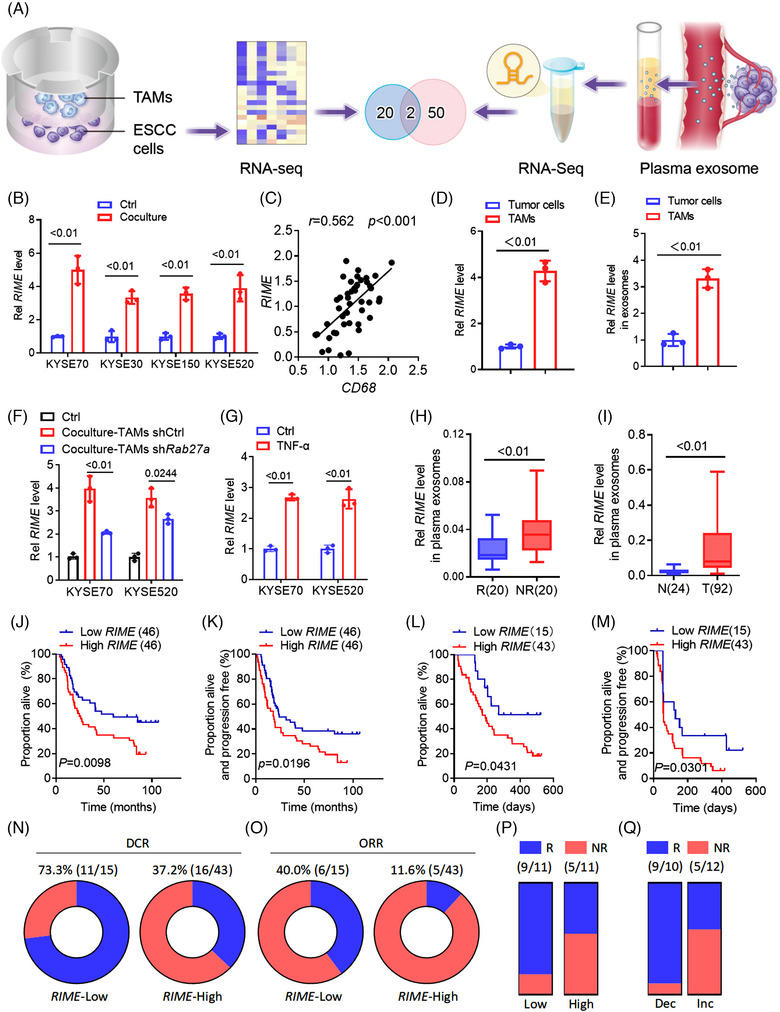
LncRNA RIME correlates with immunotherapy outcomes. (A) Illustration of tumour‐associated macrophage (TAM)‐upregulated long noncoding RNAs (lncRNAs) and plasma exosomal lncRNAs upregulated in oesophageal squamous cell carcinoma (ESCC) immunotherapy nonresponders. (B) quantitative real‐time polymerase chain reaction (qRT‒PCR) analysis showed that RIME expression was upregulated in ESCC cells cocultured with TAMs from ESCC patients. Ctrl, control. (C) qRT‒PCR and Pearson correlation analysis showed that RIME and CD68 expression in ESCC tumour tissues was positively correlated. (D) qRT‐PCR analysis showed that RIME was more highly expressed in TAMs than in ESCC tumour cells. (E) qRT‒PCR analysis of RIME expression in exosomes isolated from ESCC cells and TAMs, which showed that RIME was more highly expressed in exosomes from TAMs. (F) qRT‒PCR analysis showed that RIME expression was only partially suppressed in ESCC cells co‐cultured with Rab27a‐depleted TAMs. (G) qRT‒PCR analysis showed that TNF‐α stimulation upregulated RIME expression in ESCC cells. (H) qRT‒PCR analysis showed that RIME expression was increased in the plasma exosomes of ESCC PD‐1 mAb non‐responders compared to responders. R, responders. NR, non‐responders. (I) qRT‒PCR analysis showed that RIME expression was increased in the plasma exosomes of ESCC patients compared to healthy donors. T, ESCC patients. N, healthy donors. (J, K) OS and PFS analysis showed that high RIME expression in plasma correlated with poor OS and PFS of ESCC patients. (L, M) OS and PFS analysis showed that high RIME expression in plasma shortened OS and PFS of ESCC patients treated with PD‐1 mAb. (N, O) The disease control rate (DCR) and objective response rate (ORR) of PD‐1 mAb treatment was lower in the RIME high expression group. (P) The response rate of PD‐1 mAb plus chemotherapy (TP) in the plasma RIME high expression group was lower than RIME low expression group. (Q) The response rate of PD‐1 mAb plus chemotherapy (TP) in the plasma RIME increased (Inc) or decreased (Dec) group. Plasma RIME levels were examined before and after PD‐1 mAb plus chemotherapy (TP) treatment. qRT‐PCR analysis showed that the response rate was lower in the RIME‐increased group.