. 2023 Jun 30;29(18):3813–3825. doi: 10.1158/1078-0432.CCR-23-0827

Figure 1.

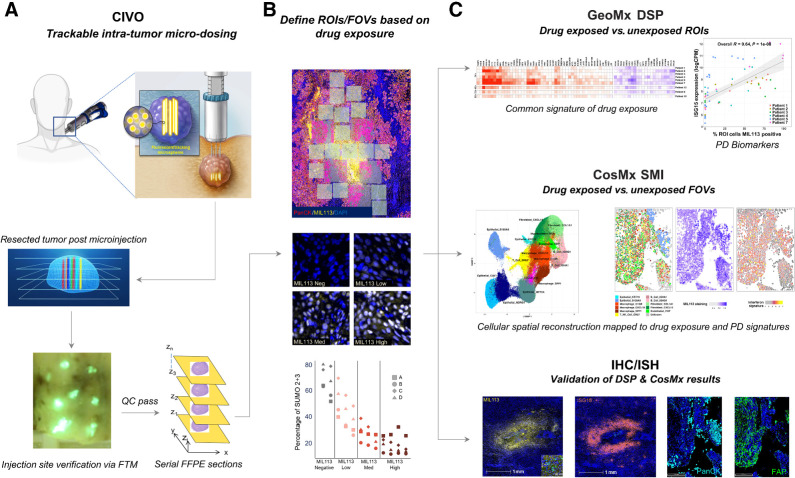
Figure 1. CIVO + GeoMx + CosMx Workflow. A, Drugs are delivered intratumorally in a columnar fashion to spatially defined positions in head and neck tumors using the CIVO microinjector. The position of each site of drug injection is identified and tracked from the initial injection procedure, through surgical resection, and ultimately spatial profiling by co-injection of fluorescent-tracking microspheres (FTM). Following incubation for 4 to 96 hours in the living intact tumor, the tumor is surgically resected and cross-sectioned perpendicular to the injection column plane. Tumors exhibiting distinct injection sites, as visualized by the presence of the FTM (fluorescent green in appearance) and verified as located in tumor tissue are processed as formalin-fixed, paraffin-embedded (FFPE) sections for downstream analysis via spatial profiling technologies and conventional IHC/ISH assays. B, Regions from FFPE sections containing trackable sites of drug target engagement are analyzed using GeoMx Digital Spatial Profiling RNA assays. Identification of localized regions of target engagement was enhanced by staining with the MIL113 antibody that specifically recognizes formation of subasumstat-SUMO adducts (yellow) and verified for inhibition of the SUMO pathway using an antibody specific for SUMO 2+3. To establish drug-induced responses across a compositionally diverse TME, multiple regions of interest (ROI) are placed at sites within and outside of graded areas of MIL113 staining (from high to low surrounding the FTM) for transcriptional profiling using probe sets such as the Cancer Transcriptome Atlas (1,800+ gene targets). C, Differential gene expression analysis was performed to determine drug-specific gene expression signatures across the patient tumor sample set. Similarly, regions within CIVO microdosed tumors can be analyzed using spatial molecular imaging such as Nanostring's CosMx technology. Gene expression at the cellular level is determined through iterative ISH and imaging for up to 1,000 gene targets. Segmented cells are assigned to cell types and cell type–specific expression levels can be compared at the cellular level within the spatial context of the intact TME. Drug-induced changes in transcript expression, detected by either DSP or SMI, are then validated at each spatially defined position of drug exposure within the TME by conventional IHC or ISH.

CIVO + GeoMx + CosMx Workflow. A, Drugs are delivered intratumorally in a columnar fashion to spatially defined positions in head and neck tumors using the CIVO microinjector. The position of each site of drug injection is identified and tracked from the initial injection procedure, through surgical resection, and ultimately spatial profiling by co-injection of fluorescent-tracking microspheres (FTM). Following incubation for 4 to 96 hours in the living intact tumor, the tumor is surgically resected and cross-sectioned perpendicular to the injection column plane. Tumors exhibiting distinct injection sites, as visualized by the presence of the FTM (fluorescent green in appearance) and verified as located in tumor tissue are processed as formalin-fixed, paraffin-embedded (FFPE) sections for downstream analysis via spatial profiling technologies and conventional IHC/ISH assays. B, Regions from FFPE sections containing trackable sites of drug target engagement are analyzed using GeoMx Digital Spatial Profiling RNA assays. Identification of localized regions of target engagement was enhanced by staining with the MIL113 antibody that specifically recognizes formation of subasumstat-SUMO adducts (yellow) and verified for inhibition of the SUMO pathway using an antibody specific for SUMO 2+3. To establish drug-induced responses across a compositionally diverse TME, multiple regions of interest (ROI) are placed at sites within and outside of graded areas of MIL113 staining (from high to low surrounding the FTM) for transcriptional profiling using probe sets such as the Cancer Transcriptome Atlas (1,800+ gene targets). C, Differential gene expression analysis was performed to determine drug-specific gene expression signatures across the patient tumor sample set. Similarly, regions within CIVO microdosed tumors can be analyzed using spatial molecular imaging such as Nanostring's CosMx technology. Gene expression at the cellular level is determined through iterative ISH and imaging for up to 1,000 gene targets. Segmented cells are assigned to cell types and cell type–specific expression levels can be compared at the cellular level within the spatial context of the intact TME. Drug-induced changes in transcript expression, detected by either DSP or SMI, are then validated at each spatially defined position of drug exposure within the TME by conventional IHC or ISH.