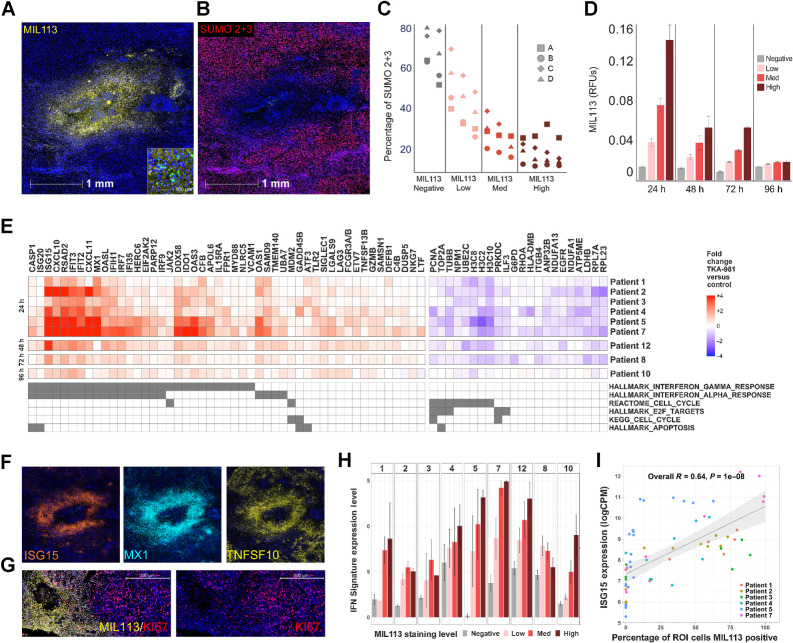
Figure 2.
Microinjection of subasumstat with CIVO induces exposure-dependent inhibition of SUMOylation, activation of an IFN response, and reduction of cell-cycle–associated gene expression across multiple tumors. A, A representative single CIVO site of subsumstat microinjection. MIL113 staining (yellow) tracks regions of target engagement (subasumstat-SUMO adduct formation) around the site of injection and demonstrates spatially localized distribution of drugs; scale bar, 1,000 μm. The original epicenter of the injection site is identified by the presence of fluorescent tracking microspheres (CIVO GLO green; inset; scale bar, 50 μm). B, The same site of localized subsumstat exposure as shown in (A) evaluated by IHC with an antibody specific for SUMO 2+3 (red) shows reduction in cells staining positive for this proximal biomarker of SUMOylation pathway activity. C, Quantification of the percentage of cells staining positive for SUMO2+3 shows an inverse relationship between level of subasumstat target engagement (MIL113 staining) and SUMOylation (%SUMO 2+3 positive). D, MIL113 staining intensity for four binned categories (negative, low, medium, and high) for tumors processed at different timepoints (24, 48, 72, and 96 hours). Error bars represent the standard error of the mean. E, Heat map of genes identified as responsive to subasumstat across nine individual tumors resected at different timepoints (24, 48, 72, and 96 hours). Linear models were fit to the data to account for different patients, slides, and injection sites and fold-change values extracted corresponding to the drug effect—subasumstat negative (negative) versus subasumstat-exposed (high, med, and low). Genes were selected if they showed a >1.5-fold change in expression between drug exposed and nonexposed ROI at Padj < 0.05 across eight of the nine patients (note patient 10 was excluded from this analysis because of weak signal at the late timepoint of 96 hours), with a consistent direction of change across all nine patients. The genes are annotated for membership of pathways identified by enrichment analysis using MSigDB (Supplementary Table S6A and S6B). F, Visualization of subasumstat-induced elevation of specific IFN response genes with ISH probes specific for ISG15 (orange), MX1 (cyan), and TNFSF10 (yellow). Note that these images are taken from the same region and the same scale as that shown for A and B. G, Visualization of subasumstat inhibition of cell cycle by dual IHC with MIL113 (yellow) and KI67 (red). Left and right panels are the same except the right panel has the channel for MIL113 staining removed to show the effect on KI67 staining; scale bar, 500 μm. H, The IFN signature score (level of signature expression) was determined for regions of high (n = 61), medium (n = 71), low (n = 55), or no MIL113 staining (n = 125). Signature scores are plotted by patient, and the level of subasumstat drug target engagement was determined by MIL113 stain intensity. Error bars represent the standard error of the mean. I, For each ROI analyzed via DSP, the relative expression of the highly IFN-responsive gene ISG15 is plotted as a function of percentage of cells that are MIL113-positive within the ROI. A linear model fit is shown with associated Pearson correlation, and P value as well as 95% confidence intervals (shaded). ISG15 expression levels are highly correlated with the percentage of cells exposed to subasumstat.

