. 2023 Jun 30;29(18):3813–3825. doi: 10.1158/1078-0432.CCR-23-0827

Figure 3.

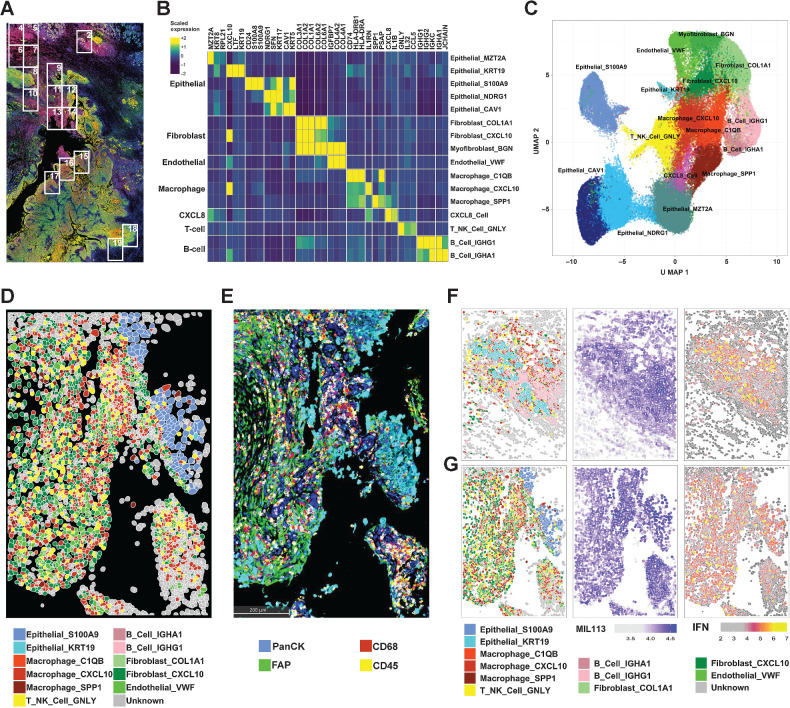
Figure 3. CosMx Spatial Imaging identifies subasumstat-responsive cells in CIVO microinjected tumors. A, Formalin-fixed, paraffin-embedded sections of tumor from patient 7 stained with DAPI, panCK, and MIL113 adjacent to the section used in the CosMx analysis. Boxes represent fields of view (FOV) collected. B, Differentially expressed genes used to identify cell types in UMAP clusters. Genes were identified for clusters from UMAP projection using the FindAllMarkers function in Seurat using parameters only.pos = TRUE, min.pct = 0.25, and logfc.threshold = 0.25. The top three genes for each cluster are shown (see Supplementary Fig. S8A for all genes and cells). Expression is the average for each cell type of the scaled gene level data across tumors 7 and 8. On the basis of the identity of the genes for each cluster a cell type was established by reference to established marker sets. C, UMAP projection of 16 cell types identified from clustering of data from patients 7 and 8. UMAP clustering was performed in Seurat using a standard workflow following data normalization and PCA. Cells (n = 93,491) are colored according to the cell identities from (B). D, Spatial reconstruction of patient 7: FOV 14. Cell identities are based on UMAP cluster (C). E, IHC staining of adjacent section to (D) showing distribution of immune cells (CD45), macrophages (CD68), epithelial cells (PanCK), and fibroblasts (FAP). F, Patient 7: FOV 2 representing adjacent normal tissue region containing salivary gland exposed to subasumstat showing reconstruction of cell types, MIL113 staining intensity, and IFN signature expression in respective panels. Note that the MIL113 staining data are from an adjacent section. G, Patient 7: FOV 14 representing a region of tumor cells exposed to subasumstat showing reconstruction of cell types, MIL113 staining intensity, and IFN signature expression in respective panels. Note that the MIL113 staining data are from an adjacent section.

CosMx Spatial Imaging identifies subasumstat-responsive cells in CIVO microinjected tumors. A, Formalin-fixed, paraffin-embedded sections of tumor from patient 7 stained with DAPI, panCK, and MIL113 adjacent to the section used in the CosMx analysis. Boxes represent fields of view (FOV) collected. B, Differentially expressed genes used to identify cell types in UMAP clusters. Genes were identified for clusters from UMAP projection using the FindAllMarkers function in Seurat using parameters only.pos = TRUE, min.pct = 0.25, and logfc.threshold = 0.25. The top three genes for each cluster are shown (see Supplementary Fig. S8A for all genes and cells). Expression is the average for each cell type of the scaled gene level data across tumors 7 and 8. On the basis of the identity of the genes for each cluster a cell type was established by reference to established marker sets. C, UMAP projection of 16 cell types identified from clustering of data from patients 7 and 8. UMAP clustering was performed in Seurat using a standard workflow following data normalization and PCA. Cells (n = 93,491) are colored according to the cell identities from (B). D, Spatial reconstruction of patient 7: FOV 14. Cell identities are based on UMAP cluster (C). E, IHC staining of adjacent section to (D) showing distribution of immune cells (CD45), macrophages (CD68), epithelial cells (PanCK), and fibroblasts (FAP). F, Patient 7: FOV 2 representing adjacent normal tissue region containing salivary gland exposed to subasumstat showing reconstruction of cell types, MIL113 staining intensity, and IFN signature expression in respective panels. Note that the MIL113 staining data are from an adjacent section. G, Patient 7: FOV 14 representing a region of tumor cells exposed to subasumstat showing reconstruction of cell types, MIL113 staining intensity, and IFN signature expression in respective panels. Note that the MIL113 staining data are from an adjacent section.