Figure 5.
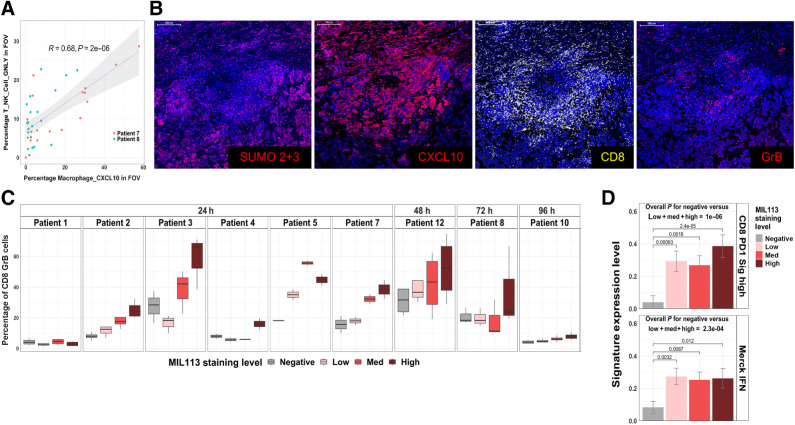
Presence of CXCL10 macrophages correlates with an increase in localized recruitment of cytotoxic immune cells. A, Correlation of the percentage of T, NK, and granulolysin (GNLY)-positive cells in CosMx FOVs to the percentage of Macrophage_CXCL10 cells. A linear model fit is shown with associated Pearson correlation, and P value as well as 95% confidence intervals (shaded). Note that the MIL113 staining data are from an adjacent section. B, Immunofluorescent staining for SUMO 2+3, CXCL10, CD8, and granzyme B at site of subasumstat drug target engagement in patient 7; scale bar, 500 μm. C, Relationship between activated T cells and subasumstat target engagement across patient samples is plotted as the percentage of CD8+GrB+ cells. Box plot represents the distribution and the median value of multiple tumor sections taken from different tumor regions within each patient and analyzed for response to subasumstat target engagement. D, Expression of two signatures of T-cell activation; “CD8 PD1 Sig high” (45) and “Merck IFN” (44) grouped by MIL113 grade. Signature values were calculated by GSVA and grouped by MIL113-staining levels from DSP data for 354 ROI from nine patients. Error bars represent standard error of the mean for grouped data. P values for CD8 PD1 signature high: low = 0.00083, med = 0.0016, high = 2.4×10⁻⁵. P values for Merck IFN signature: low = 0.0032, med = 0.0087, high = 0.012. The overall P value represents a t test comparing the drug-unexposed (negative) to drug-exposed (low, med, high) ROI.

