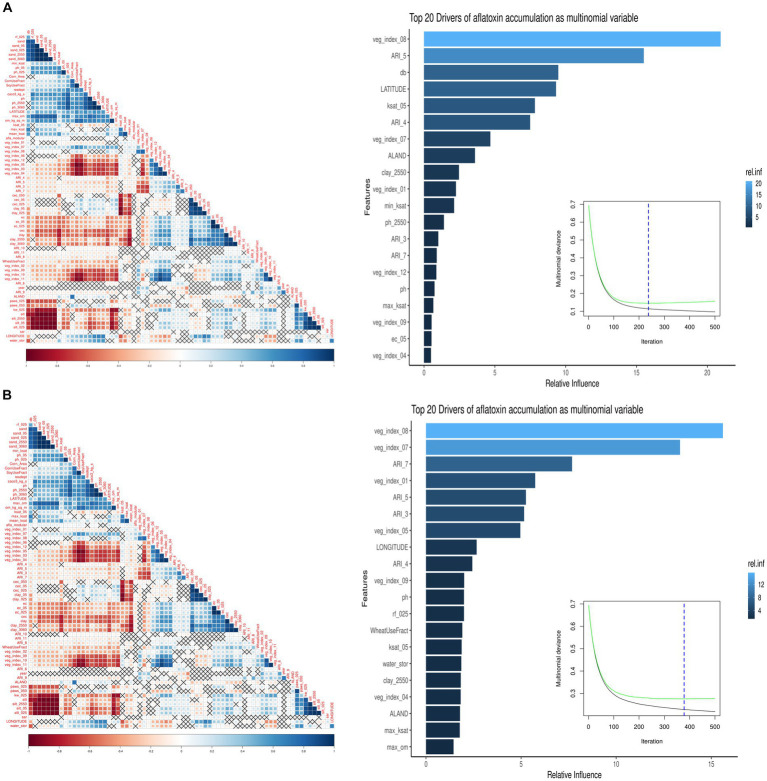
Figure 1.
Summary of the GBM model using multinomial AFL outcomes. The left image is a pair-wise correlation analysis of all the model predictors for AFL using the hclust method. The correlation level is depicted from positive correlation (blue) to negative correlation (red); black crosses represent non-significant p-values of correlation analysis between all predictors. The p-values cut-off was 0.05, and the confidence level was 0.95. The right image summarizes the GBM model using multinomial AFL outcomes, showing the number of iterations where cross-validation error is minimized, and the relative influencing parameters of AFL contamination in Iowa corn. The AFL model used an interaction depth of 1, shrinkage of 0.01, and 10 c.v. folds. The top 20 influential predictors and their relative influence within the model for predicting AFL. The blue hue represents levels of the relative influence of the predictors, where light blue has high and dark blue has low influences. (A) Pair-wise correlation for 20-ppb threshold, 237 total iterations, and 26 predictors being a non-zero influence. (B) Pair-wise correlation for 5-ppb threshold, 378 total iterations, and 53 predictors being a non-zero influence.

