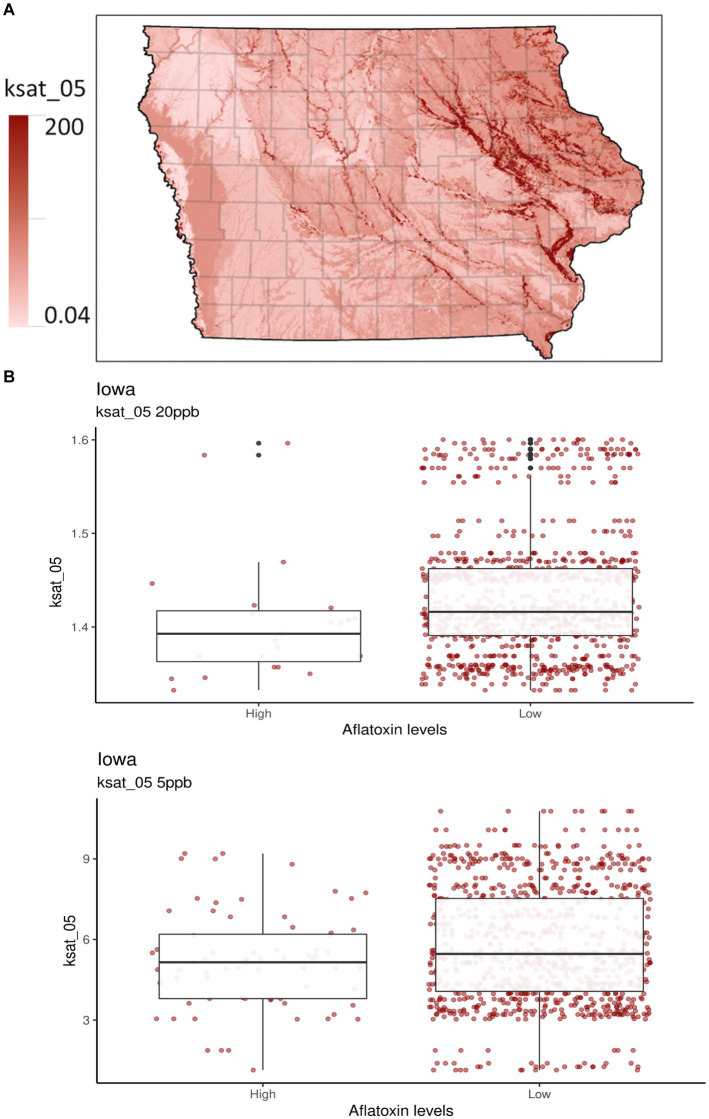
Figure 2.
Selected soil properties of Iowa. Ksat_05 measures the saturated hydraulic conductivity from the soil surface to 5 cm depth in units of μm sec−1. (A) The gradient graph is the Ksat_05 across Iowa. (B) The boxplots are for Ksat_05 with high and low AFL contamination levels for 20- and 5-ppb risk thresholds, respectively.

