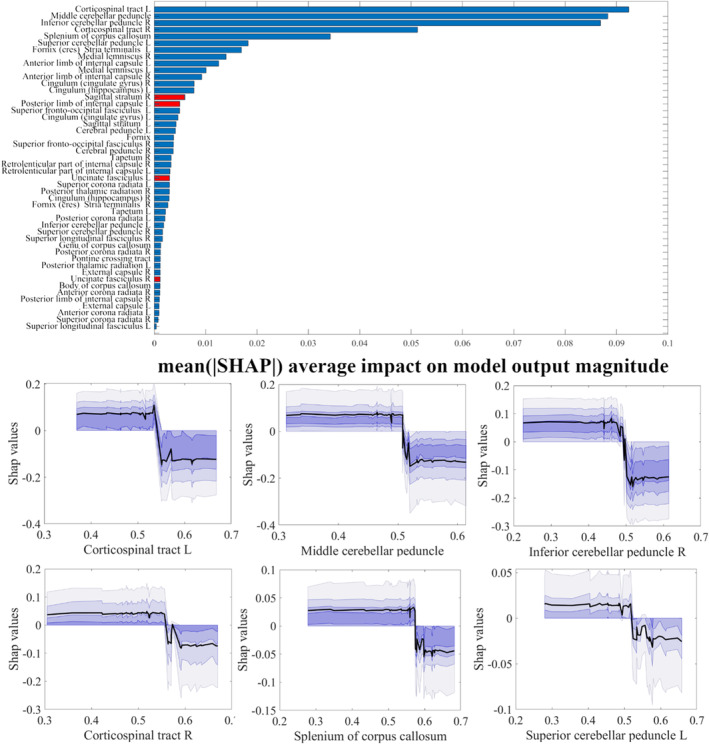
FIGURE 5.

Upper panel: ranking of ROI‐wise FR values contributing to the discrimination of HIV‐positive patients from healthy control subjects (SHAP values, averaged across the whole sample). Red bars represent ROIs with higher FR values in HIV patients, while blue bars represent the opposite. Lower panel: individual dependence of SHAP values (i.e., feature importance) on FR values in each of the top six ranking ROIs in the upper panel.
