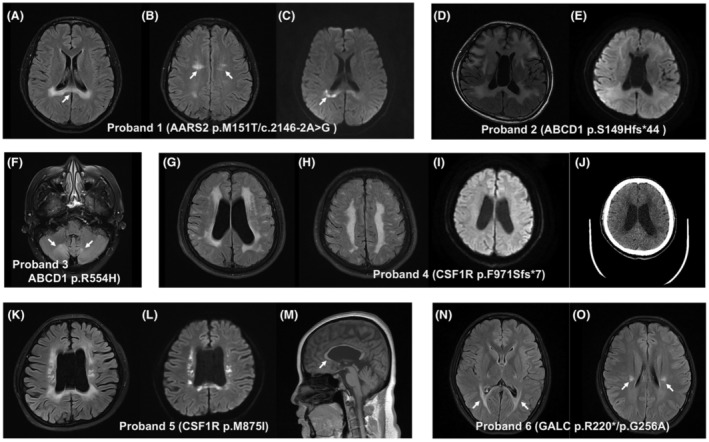
Figure 2.

Brain magnetic resonance imaging (MRI) and computerized tomography (CT) findings in patients with genetic leukodystrophies. Hyperintensities in the body of the corpus callosum (A, arrow) and periventricular white matter (B, arrows) on T2 FLAIR images, and restricted diffusion on diffusion‐weighted MR images (C, arrow), were observed in the patient (proband 1) with AARS2 mutations. (D) Axial T2 FLAIR images in the patient (proband 2) with ABCD1 p.S149Hfs*44 mutation show hyperintense signal changes involving not only the periventricular white matter and corpus callosum, but also internal and external capsules. (E) There was no restricted diffusion detected on diffusion‐weighted MR images of the same patient. (F) Axial T2 FLAIR MR images showing nonspecific hyperintensities of the white matter in bilateral cerebellar hemispheres (arrows) in the patient (proband 3) with ABCD1 p.R554H mutation. (G and H) Axial T2 FLAIR MR images in the patient (proband 4) with CSF1R p.F971Sfs*7 mutation show hyperintensities in the periventricular and deep subcortical white matter. There was no restricted diffusion observed on diffusion‐weighted MR images of the same patient (I). (J) Axial noncontrast brain CT of the same patient demonstrated no calcification. Ventricular enlargement and corpus callosal atrophy (M, arrow), with hyperintensities in periventricular white matter on T2 FLAIR images (K) and restricted diffusion on diffusion‐weighted MR images (L), are observed in the patient (proband 5) with CSF1R p.M875I mutation. (N and O) Axial T2 FLAIR MR images in the patient (proband 6) with GALC mutations show involvement of the corticospinal tracts and periventricular white matter (arrows).
