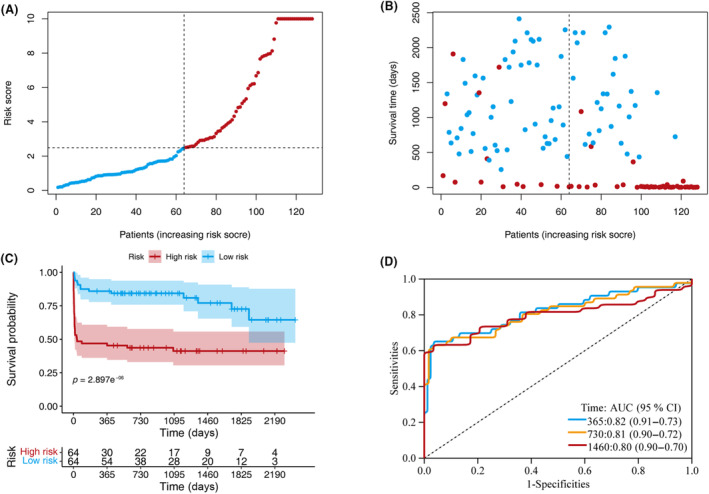
Figure 2.

Model discrimination and performance in the training set. (A) Distribution of participants in the low‐ and high‐risk score categories based on survival status. (B) Comparison of survival risk between the two groups. (C) Overall survival curves were separated by groups with low‐ and high‐risk scores. (D) Time‐dependent receiver operating characteristic curves of the scoring system in the training set.
