Figure 3.

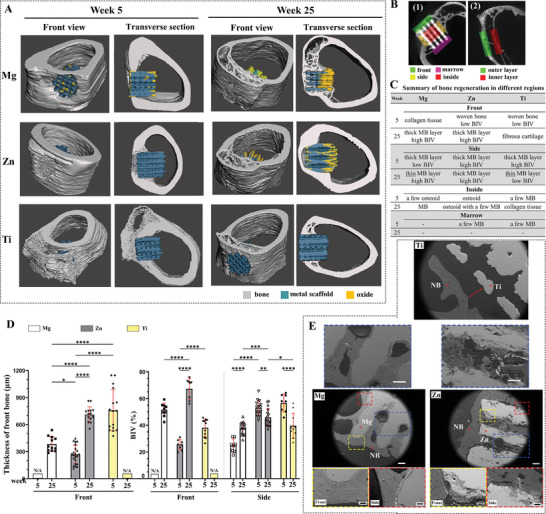
Bone regeneration. A) 3D models derived from representative Micro‐CT scans incorporating bone tissue and the scaffold. Six models: Mg scaffold at 5‐ and 25‐weeks post‐implantation, Zn scaffold at 5‐ and 25‐weeks post‐implantation, and Ti at 5‐ and 25‐weeks post‐implantation. Two angles of view: front view (left) and transverse section (right). B) Illustration of regions of interest for bone tissue assessment in 1) scaffold groups and 2) sham groups. C) Summary of bone regeneration in different regions, including front, side, inside, and marrow regions. MB: mineralized bone, BIV: bone‐to‐implant volume. D) The thickness of newly formed bone in the front region and bone‐implant volume (BIV) in front and side regions within a 1 mm range, derived from histochemistry staining images (>10). Data are presented as mean ± SEM. *P < 0.05, **P < 0.01, ***P < 0.001, ****P < 0.0001 (one‐way ANOVA). E) SEM images demonstrating osseointegration of Mg, Zn, and Ti scaffolds after 25 weeks of implantation. Yellow dotted boxes show detailed bone‐scaffold interfaces in the front regions, red ones present those in the side region, and blue ones demonstrate the tissue condition in the inside regions. Red arrows indicate gaps between bone tissue and Ti scaffold. E) White scale bar: 200 µm, black scale bar: 50 µm.
