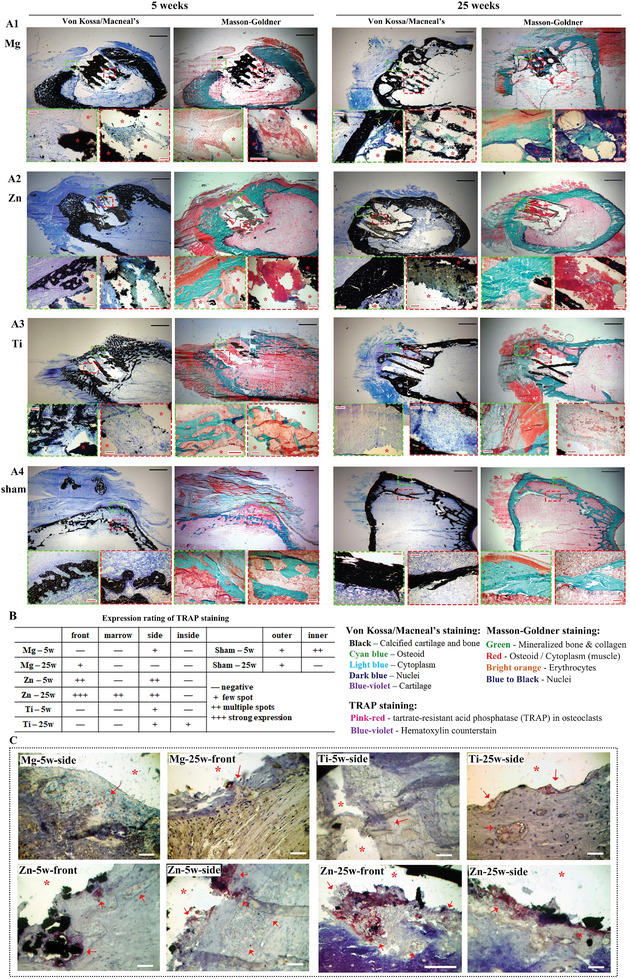
Figure 4.

Histochemical staining. Von Kossa/Macneal's staining and Masson‐Goldner staining of A1) Mg scaffold, A2) Zn scaffold, A3) Ti scaffold, and A4) sham control after 5 and 25 weeks of implantation. Green boxes show detailed histological structures in front of the scaffold, while red boxes show structures inside the scaffold. Black scale bar: 2 mm, red scale bar: 200 µm. B) Summary of expression ratings for TRAP staining in all samples. C) Representative TRAP staining images of front and side regions of scaffolds. * indicates the location of the scaffold, → indicates spots with positive TRAP staining. White scale bar: 100 µm.
