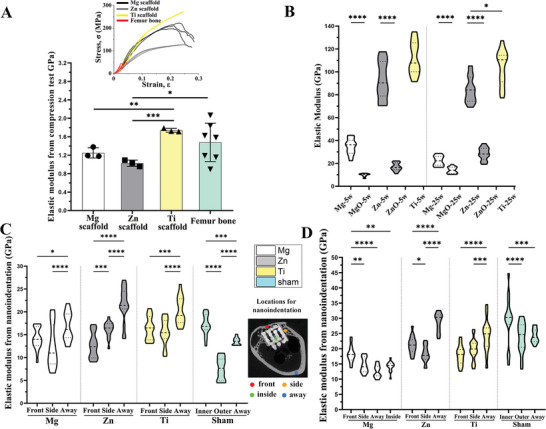
Figure 6.

Mechanical analysis. A) Young's modulus of Mg, Zn, and Ti scaffolds and femur bone derived from the compression test. The inset figure shows the stress‐strain curves. B) Young's modulus of metals (Mg, Zn, and Ti) and oxides (MgO and ZnO) derived from the nanoindentation test on scaffolds after implantation of 5 and 25 weeks. Young's modulus derived from the nanoindentation test on bone tissue in different regions of the scaffold (front, side, inside, and away) and two bone layers of the sham control group (outer and inner) after implantation of 5 weeks C) and 25 weeks D). The inset figure indicates locations assessed with nanoindentation. Data are presented as means ± SEM. *P < 0.05, **P < 0.01, ***P < 0.001, ****P < 0.0001 (one‐way ANOVA).
