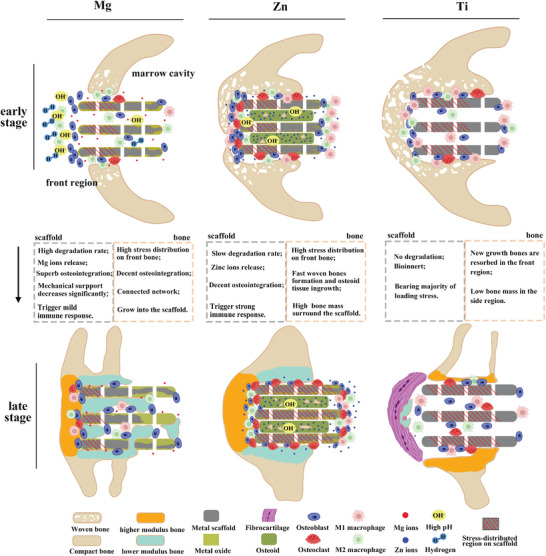
Figure 8.

The schematic diagram of the interaction between scaffolds and bone regeneration. The schematic diagram illustrates the degradation trend of Mg and Zn scaffolds, along with bone regeneration strategies corresponding to different scaffolds in the early and late stages. Bone morphology and distribution are derived from Micro‐CT, SEM, and histochemical staining images, while cell distribution is based on TRAP staining and IHC staining.
