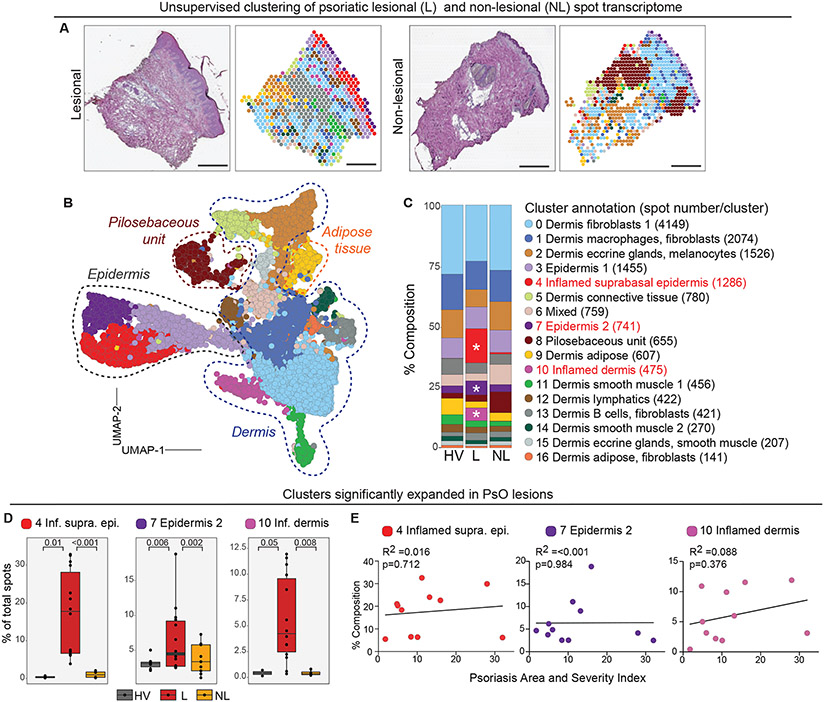
Figure 3. ST analyses of psoriatic (PsO) lesional and non lesional skin.
(A) Representative histological image (left) and corresponding ST plots following Harmony batch correction (right) of lesional PsO and non-lesional skin samples. Scale bar = 440μm (B) UMAP visualization of 16,424 spots obtained from combined psoriatic lesional (n=14) and non lesional (n=9), and healthy (n=5) skin samples. Dashed lines around clusters discern region specific clusters. (C) Composition plots indicating the relative abundance of each cluster in healthy volunteer (HV), lesional (L), non-lesional (NL) samples. Asterix denotes significantly expanded clusters (p≤0.05, see D for absolute p values) (D) Box plots depicting frequency of PsO-enriched clusters 4, 7, and 10 in different sample groups. Each black dot represents an individual biopsy sample. P values computed using Wilcoxon rank sum test. (E) Linear regression plots of clusters 4, 7, and 10 percent composition in PsO lesional samples (y-axis) and corresponding sample Psoriasis Area and Severity Index score (x-axis). Each dot represents an individual biopsy sample. n= number of skin sections analysed.

