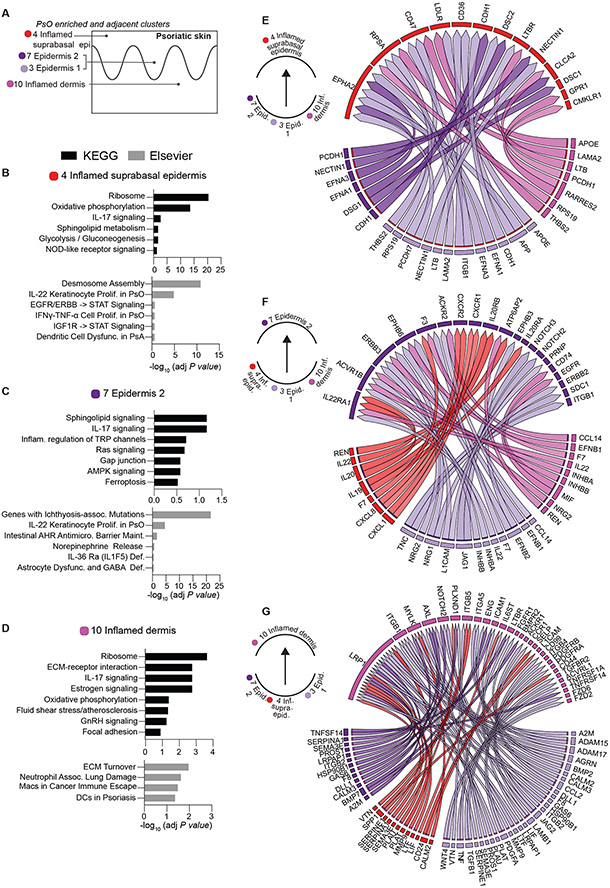
Figure 4. Pathways and ligand receptor interactions in psoriasis-enriched clusters.
(A) Schematic illustrating spatial locations of psoriasis-enriched (4,7,10) and adjacent cluster (3). (B-D) KEGG and Elsevier pathways analyses of clusters 4, 7, and 10, respectively. (E-G) Circle plots of NicheNet-predicted ligand-receptors interactions in clusters 4, 7, and 10 and ligands in cluster 3. Arrow point from putative ligand/sender to receptor/receiver clusters are denoted on the left of each circle plot. For total Niche-net output see data file S1.

