Figure 1.

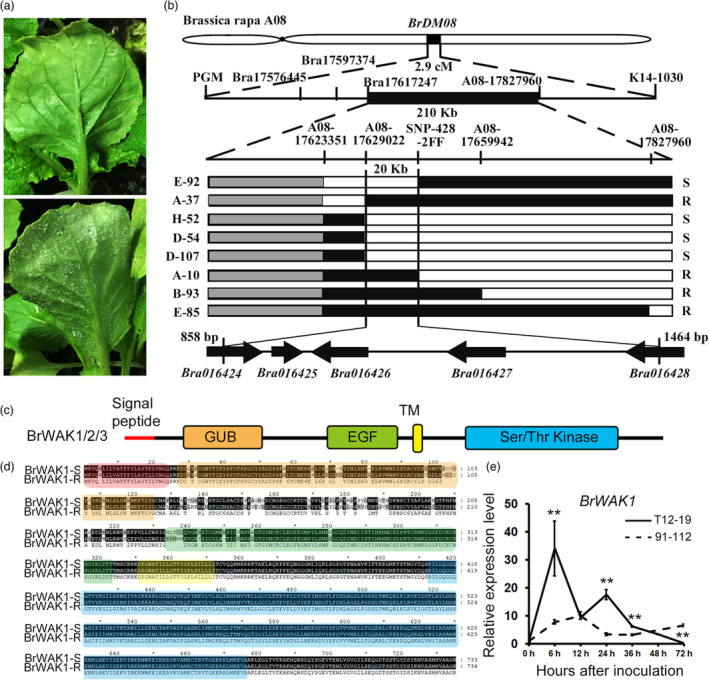
Fine mapping of the downy mildew resistant QTL Bra‐DM08. (a) Downy mildew symptoms in T12–19 (upper panel) and 91–112 (lower panel). (b) Fine mapping of Bra‐DM08. The vertical lines represent the sites of molecular markers. The grey, black, and white rectangle represent undetected, heterozygous, and homozygous sites from 91 to 112, respectively. The name of recombinant lines and phenotype are listed on the left and right, respectively. “R” means resistant and “S” means susceptible. The genes in Bra‐DM08 are shown by black arrows. (c) Schematic diagram of the conserved domains in BrWAK1/2/3. (d) The amino acid sequence alignment of BrWAK1 in T12–19 and 91–112. The sequences in the conserved domains are highlighted by different background colours, which are consistent with those in c. (e) The expression levels of BrWAK1 in T12–19 and 91–112 at 0, 6, 12, 24, 36, 48, and 72 h after inoculation. More than ten leaves were collected in each replicate. Expression of each gene at 0 h after inoculation in T12–19 or 91–112 was defined as 1.0. Values represent means ± SD (n = 3) from three biological replicates. Statistical significance between 0 h after inoculation in T12–19 or 91–112 was by a t‐test: **P < 0.01.
