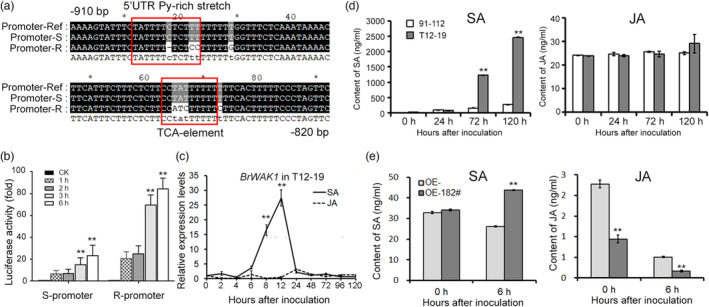
Figure 4.

SA could accumulate and induce the expression of BrWAK1 after inoculation. (a) Part of the BrWAK1 promoter sequence in T12–19 with distinct cis‐transcription element from that in 91–112. (b) The activity of the BrWAK1 promoter in 91–112 (S‐promoter) and in T12–19 (R‐promoter) after SA treatment in the double‐LUC reporter assay in Chinese cabbage protoplast cells. Values represent means ± SD (n = 3) from three biological replicates. Statistical significance between CK sample (without SA treatment) was by a t‐test: **P < 0.01. (c) The expression of BrWAK1 in T12–19 at 0, 2, 4, 6, 8, 12, 24, 48, 72, 96, and 120 h after 1.5 mm SA and 1 mm JA treatment. More than five leaves were collected in each replicate. Expression of BrWAK1 at 0 h in SA and JA treatment (CK) was defined as 1.0. Values represent means ± SD (n = 3) from three biological replicates. Statistical significance between CK was by a t‐test: **P < 0.01. (d) The contents of SA and JA in 91–112 and T12–19 at 0, 24, 72, and 120 HAI. More than five leaves were collected in each replicate. Values represent means ± SD (n = 3) from three biological replicates. Statistical significances between 91 and 112 samples were by a t‐test: **P < 0.01. (e) The contents of SA and JA in the BrWAK1 overexpression line (OE‐182) and the transgenic line without BrWAK1 overexpression (OE‐) at 0, 24, 72, and 120 HAI. More than five leaves were collected in each replicate. Values represent means ± SD (n = 3) from three biological replicates. Statistical significances between 91 and 112 samples were by a t‐test: **P < 0.01.
