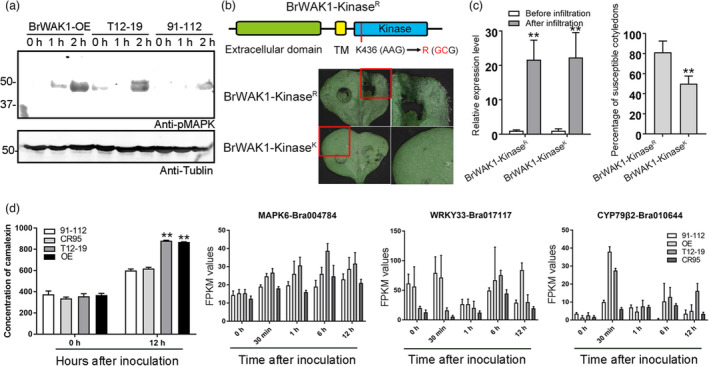
Figure 7.

BrWAK1 could interact with BrBAK1 to activate downstream signalling. (a) MAPK phosphorylation in the BrWAK1 overexpression lines, T12–19, and 91–112 at 0, 1, and 2 HAI. The tubulin protein in each sample was used as the loading control. (b) The schematic diagram of kinase activity site mutated BrWAK1 (K436R, BrWAK1‐KinaseR) and the disease symptoms of cotyledons infiltrated with BrWAK1‐KinaseR and BrWAK1 without mutation (BrWAK1‐KinaseK) after inoculation. The images in red rectangles are enlarged in the right panels. (c) The expression levels of BrWAK1‐Kinase R and BrWAK1‐Kinase K in injected cotyledons before and after inoculation and the susceptible percentage of infiltrated cotyledons after inoculation. Expression of BrWAK1 in samples before infiltration in each sample were defined as 1.0. Values represent means ± SD (n = 3) from three biological replicates. Statistical significances between samples before infiltration were by a t‐test: **P < 0.01. More than fifty leaves were observed after inoculation in each replicate. Values represent means ± SD (n = 3) from three biological replicates. Statistical significance between transgenic lines with kinase activity site mutated BrWAK1 (BrWAK1‐KinaseR) was by a t‐test: **P < 0.01. (d) The contents of camalexin and the expression of crucial genes involved in camalexin biosynthesis and signalling, including MAPK6, WRKY33, and CYP79β2, in 91–112, T12–19, the BrWAK1 overexpression line and the gene editing line (CR95) after inoculation. More than five leaves were collected in each replicate. Values represent means ± SD (n = 3) from three biological replicates. Statistical significances between the camalexin concentrations of 91–112 at 0 HAI were by a t‐test: **P < 0.01.
