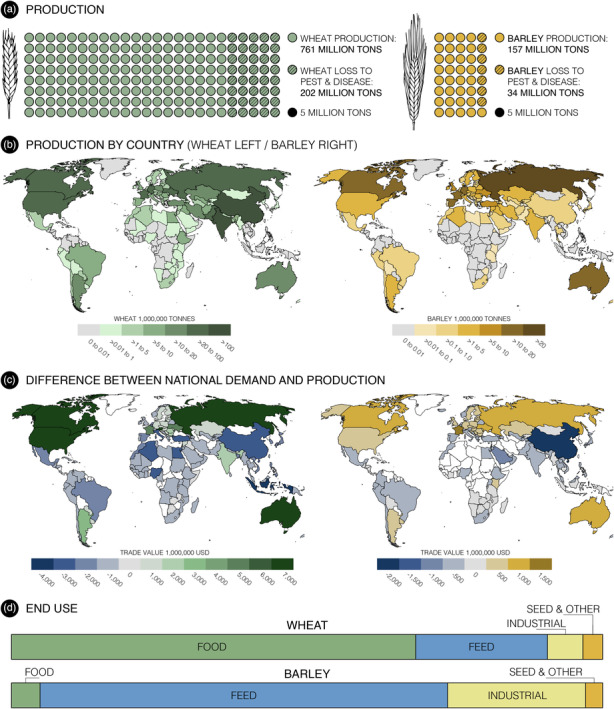
Figure 1.

Global wheat and barley production relative to demand and the effect of pests and diseases on grain yield and end‐use data. (a) Estimates of yield loss to pests and diseases adapted from expert‐based assessments of crop health (Oerke and Dehne, 2004; Savary et al., 2019). (b) Worldwide wheat and barley production by country in 2017 (FAO stats accessed on 1 September 2022). (c) Trade deficit/surplus calculated as the value in US dollars between national demand and production for wheat and barley. (d) End‐use data for wheat and barley in 2020/21 as a proportion of whole production. https://www.igc.int/en/markets/marketinfo-sd.aspx (accessed on 1 September 2022). For the purpose of this map, the authors used production and trade data reported by the FAO and the World Bank. The authors remain neutral on issues of disputed regions and borders.
