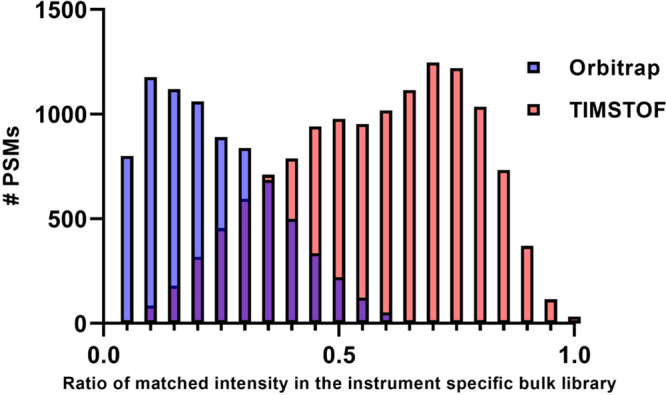
Figure 2.

Histogram demonstrating the ratio of matched fragment intensity values when comparing single-cell fragmentation spectra to bulk data from each instrument. In this metric, 1.0 would represent spectra with a 100% fragment intensity match between bulk and single-cell spectra.
