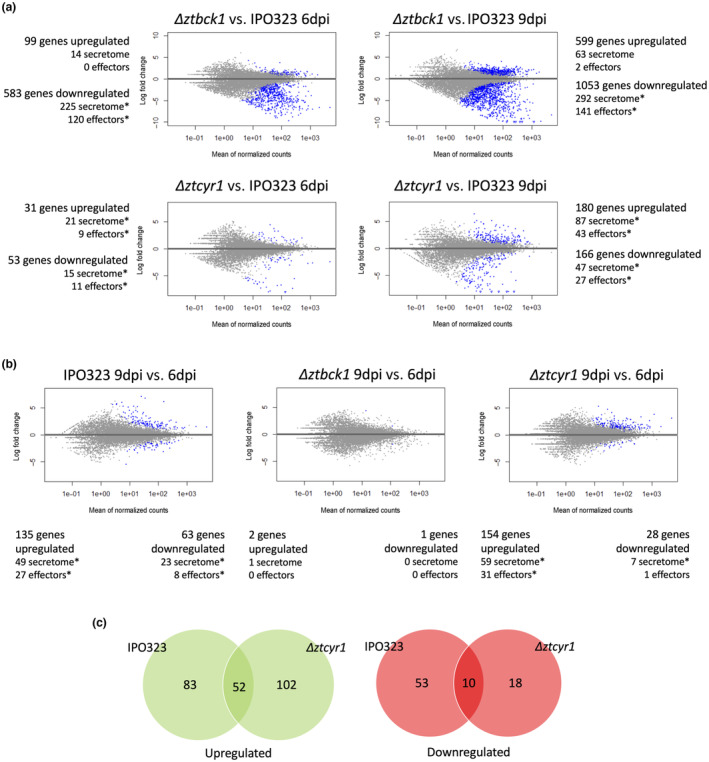
FIGURE 4.

Δztbck1 shows widespread down‐regulation of secreted effectors and Δztcyr1 gene expression diverges from IPO323 as infection progresses. MA plots, of the log fold change in expression versus expression level (mean of normalized counts) are shown, displaying differentially expressed genes (blue points) between (a) mutant strains (Δztbck1 and Δztcyr1) and IPO323 at 6 and 9 days postinoculation (dpi), and (b) between 9 and 6 dpi in IPO323 (left), Δztbck1 (middle), and Δztcyr1 (right). The number of differentially expressed genes in each comparison are detailed, as well as the number of secretome and predicted effector genes in those differentially expressed sets. Asterisks indicate significant enrichment of these gene categories amongst differentially expressed gene sets determined using Fisher's exact tests (p < 0.01). (c) Comparison of genes found to be differentially expressed between 6 and 9 dpi in IPO323 and Δztcyr1.
