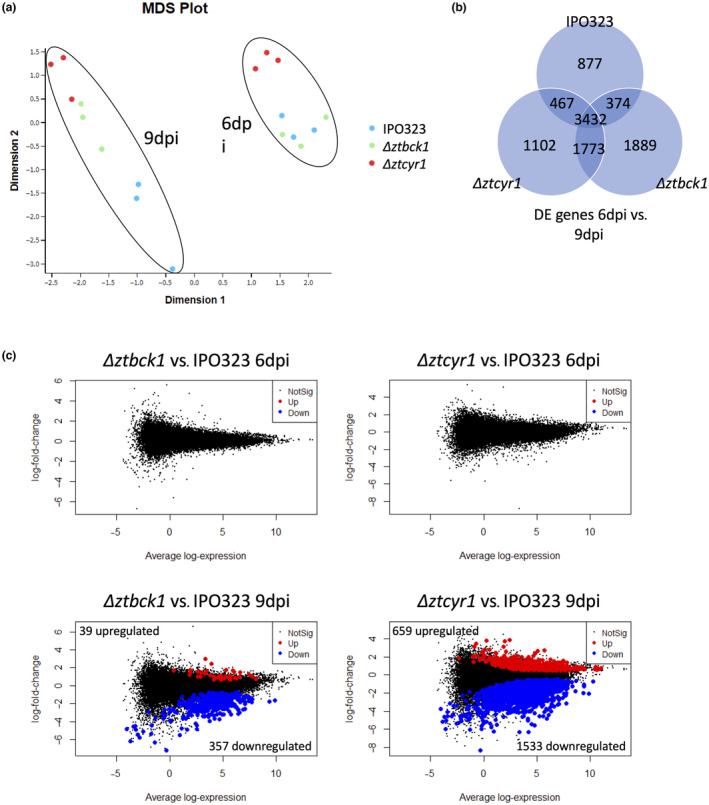
FIGURE 7.

Global wheat gene expression analysis during infection. (a) Multidimensional scaling (MDS) plot on global wheat gene expression data. (b) Comparison of genes differentially expressed between 6 and 9 days postinoculation (dpi) in leaves infected with IPO323, Δztbck1, and Δztcyr1. (c) MA plots displaying differentially expressed genes between leaves infected with Δztbck1 at 6 dpi (top left) and 9 dpi (bottom left), and Δztcyr1 at 6 dpi (top right) and 9 dpi (bottom right), using leaves infected with IPO323 each time point as a reference.
