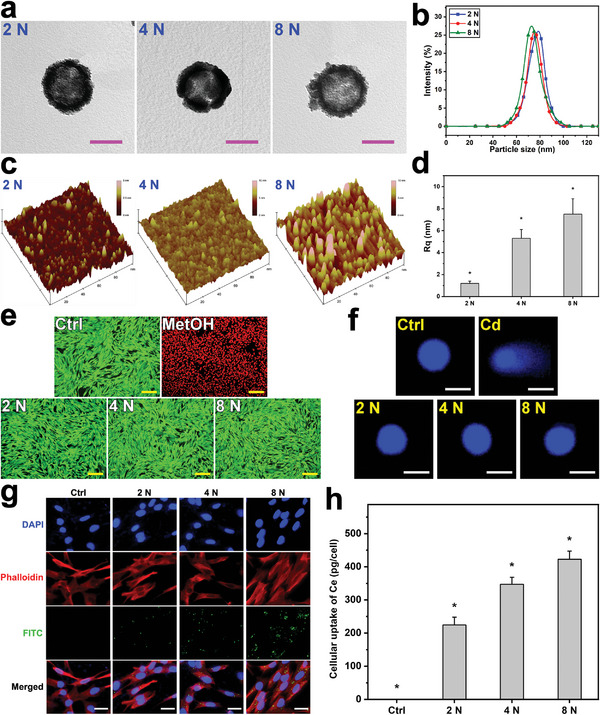
Figure 1.

Material characterization and cytocompatibility studies. a) Typical TEM images, b) DLS spectra, c) surface textures, and d) mean square roughness of the SRCNs fabricated using different etchant concentrations. Values are mean ± SD (n = 5); *P < 0.05 versus all groups. Fluorescence photomicrographs of e) live/dead and f) comet assays of RCK cultures after a 2‐day exposure to various types of SRCNs. g) CLSM images of RCKs after incubation with various types of FITC‐labeled SRCNs for 4 h. h) Cellular uptake efficiency of the SRCNs. Values are mean ± SD (n = 5); *P < 0.05 versus all groups. Scale bars in a,e,f,g) are 50 nm, 50 µm, 10 µm, and 20 µm, respectively.
