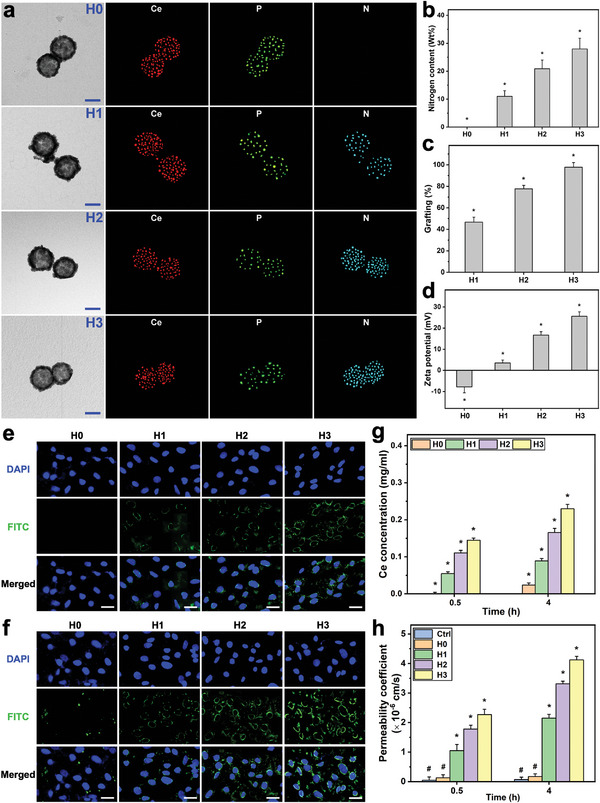
Figure 3.

Nanocarrier functionalization and permeability studies. a) TEM images and corresponding EDS maps of cerium, phosphorus, and nitrogen of the PEGylated/functionalized SRCNs (H0, H1, H2, and H3 samples). Scale bars are 50 nm. b) The nitrogen content, c) amino group content, and d) zeta potential of the samples. Values are mean ± SD (n = 5); *P < 0.05 versus all groups. The CLSM images of RCKs treated with the samples for e) 0.5 h and f) 4 h. Scale bars are 20 µm. g) Cellular uptake efficiency of the various functionalized SRCNs. Values are mean ± SD (n = 5); *P < 0.05 versus all groups. h) Permeability coefficient of the samples. Values are mean ± SD (n = 5); *P < 0.05 versus all groups; # P < 0.05 versus H1, H2, and H3 groups.
