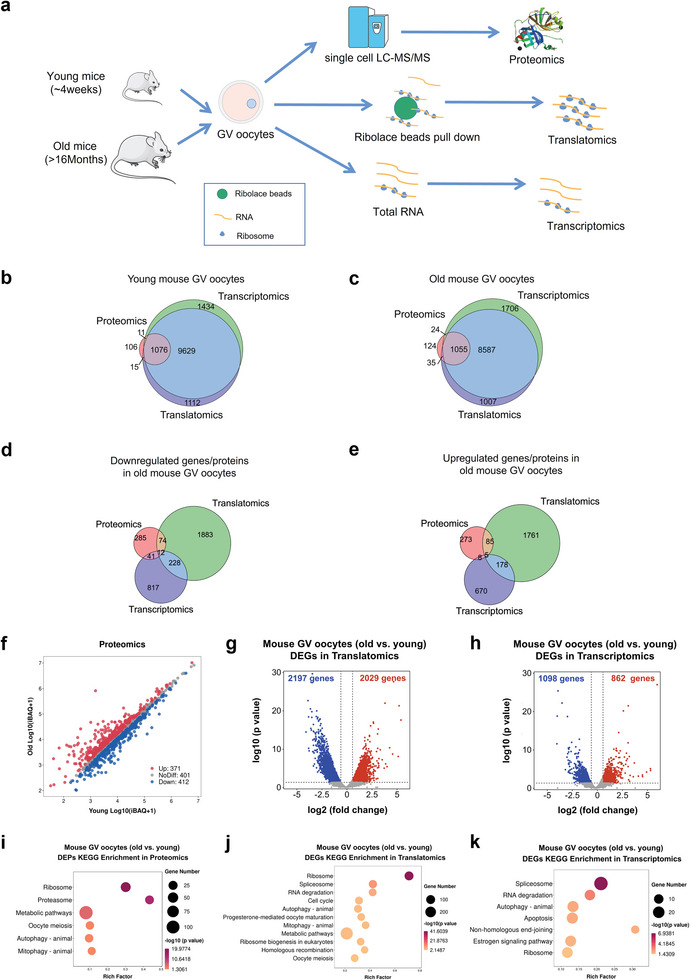
Figure 1.

Single‐cell proteomics, ultrasensitive translatomics, and transcriptomics of aged and young mouse oocytes. a) Schematic graph depicting the major procedures of multi‐omics profiling in aged and young mouse GV oocytes. For single‐cell proteome profiling, one biological replicate of 1 oocyte was performed; for ultrasensitive transcriptomics and translatomics profiling, three biological replicates of 4 oocytes were generated. b,c) Venn plot of detected genes generated by single‐cell translatomics (TPM>1 for any biological replicate), RNA‐seq (TPM>1 for any biological replicate), and proteome‐identified genes in young mouse oocytes (≈4 weeks old) and in aged mouse oocytes (>16 months old). d) Venn diagram showing the overlap of genes downregulated in aged mouse GV oocytes detected from the ultrasensitive translatomics (FC<0.67), RNA‐seq (FC<0.67), and proteome (FC<0.83). e) Venn diagram showing the overlap of genes upregulated in aged mouse GV oocytes detected from the ultrasensitive translatomics (FC>1.5), RNA‐seq (FC>1.5), and proteome (FC>1.2). f) Scatter plot demonstrating the differentially expressed proteins between aged and young mouse GV oocytes. Red and blue dots denote up‐ and down‐regulated proteins, respectively. g,h) Volcano diagram showing DEGs detected by ultrasensitive translatomics (g) and transcriptomics (h). Red and blue dots denote up‐ and down‐regulated genes, respectively. p < 0.05, FC>1.5 or <0.67. i–k) Representative KEGG analysis of the differentially expressed proteins/DEGs detected by proteomics (i), translatomics (j), and RNA‐seq (k). TPM, transcripts per million. DEGs, differentially expressed genes. KEGG, Kyoto Encyclopedia of Genes and Genomes.
