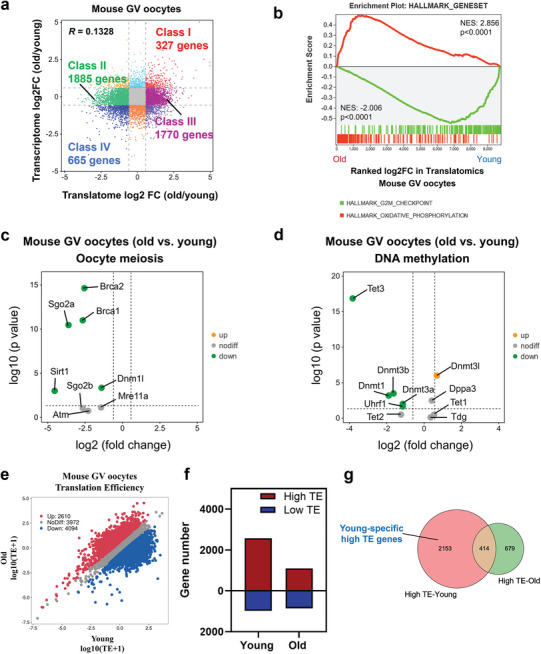
Figure 2.

Distinct translational patterns in aged and young mouse GV oocytes. a) Scatter plot showing the changes in gene translation and transcription during oocyte aging. Class I (red) denotes genes with upregulated translation and transcription in aged mouse GV oocytes. Class II (green) denotes genes translationally downregulated in aged mouse GV oocytes but transcriptionally constant. Class III (purple) denotes genes translationally upregulated in aged mouse GV oocytes but transcriptionally constant. Class IV (blue) denotes genes with downregulated translation and transcription in aged mouse GV oocytes. Downregulated, FC<0.67; upregulated, FC>1.5. b) Gene set enrichment analysis of the translatomics showing the translationally downregulated genes enriched in the hallmark of the G2/M checkpoint and translationally upregulated genes enriched in the hallmark of oxidative phosphorylation. c) Volcano plot showing the changes in oocyte meiosis‐related genes identified by the translatomics. d) Volcano plot showing the changes in the DNA methylation regulatory genes identified by the translatomics. e) Scatter plot showing the RNA TE alterations of aged mouse oocytes compared with young mouse oocytes. Red and blue dots denote up‐ and down‐regulated genes, respectively. Upregulated, FC>1.5; downregulated, FC<0.67. f) Bar plots showing the numbers of high‐TE genes (TE>2) and low‐TE genes (TE<0.5) in young and aged mouse GV oocytes, respectively. g) Venn diagram showing the overlap of high‐TE genes identified from young and aged mouse GV oocytes. TE, translation efficiency. FC, fold change.
