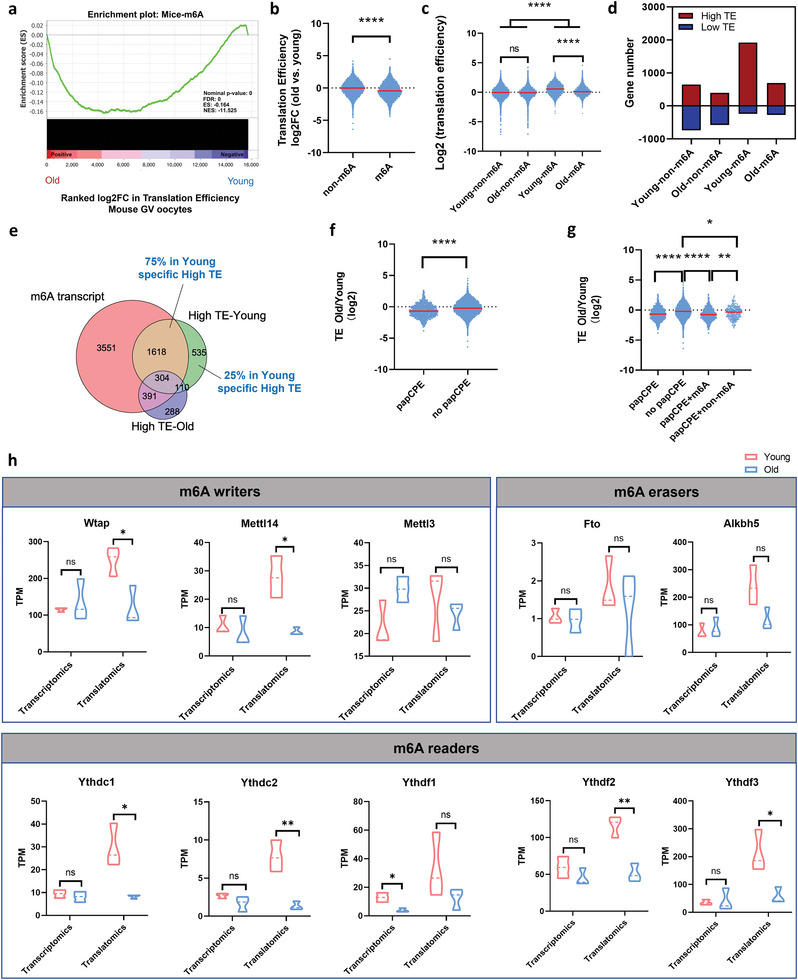
Figure 3.

M6A modification that mediates translation downregulation is altered in aged mouse GV oocytes. a) Gene set enrichment analysis showing that the TE of m6A‐enriched RNA was significantly decreased. b) Violin plots showing the TE changes in the genes of the group not enriched by m6A and of the m6A‐enriched group in aged mouse oocytes compared with young mouse oocytes. p‐Value was calculated with Student's t‐test for independent samples. c) Violin plots showing TE (log2) in young and aged mouse oocytes for m6A‐enriched genes or in genes not enriched by m6A. p‐Values were calculated with one‐way ANOVA and Bonferroni post hoc test. d) Bar plots showing the numbers of high‐TE genes and low‐TE genes among the four groups. The minus sign indicates the number of downregulated genes. e) Venn diagram showing the overlap of the m6A‐enriched gene set, high‐TE genes in young mouse GV oocytes, and high‐TE genes in aged mouse GV oocytes. f) Violin plots showing the TE changes in genes of the papCPE‐containing group and in genes of the group not containing papCPE in aged mouse oocytes compared with young mouse oocytes. p‐Value was calculated with Student's t‐test for independent samples. g) Violin plots showing the TE changes in four groups of genes in aged mouse oocytes compared with young mouse oocytes. p‐Values were calculated with one‐way ANOVA and Bonferroni post hoc test. h) Transcriptional and translational expression levels of the representative m6A‐related genes in mouse GV oocytes. Data are shown as the mean ± SEMs. p‐Values were calculated with Student's t‐test for independent samples. TE, translational efficiency. papCPE, cytoplasmic polyadenylation elements (CPEs) within 100 bp of PASs. Ns, no significant difference. *p < 0.05, **p < 0.01, ****p < 0.0001.
