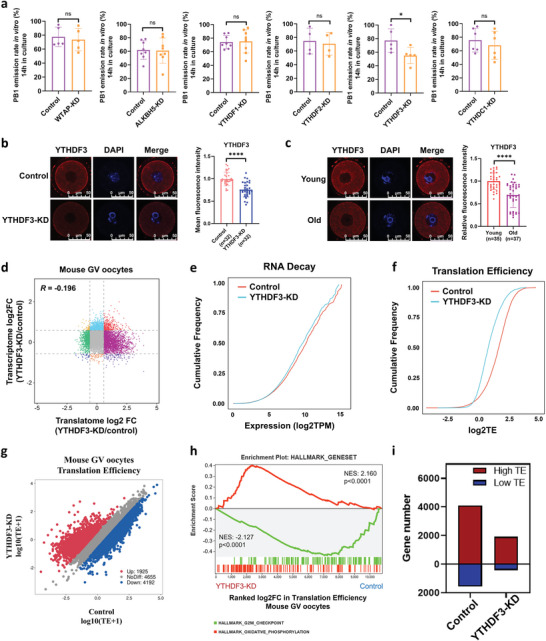
Figure 4.

YTHDF3 deficiency inhibits RNA TE in mouse oocytes. a) The in vitro PB1 emission rates of mouse oocytes from the control groups and the m6A‐related gene depletion groups. Each dot represents a single biological replicate. p‐Values were calculated with Student's t‐test for paired samples. b) Immunofluorescence verifying the depletion of YTHDF3 by Trim‐Away. Scale bar, 50 µm. The right panel shows the quantification of YTHDF3 protein levels. The average intensity of the control group oocytes was set as 1.0. Each dot represents a single oocyte analyzed. p‐Value was calculated with two‐tailed Mann–Whitney test. c) Immunofluorescence verifying the expression of YTHDF3 in young and aged mouse GV oocytes. Scale bar, 50 µm. The right panel shows the quantification of YTHDF3 protein levels. The average intensity of young mouse oocytes was set as 1.0. Each dot represents a single oocyte analyzed. p‐Value was calculated with two‐tailed Mann–Whitney test. d) Scatter plot showing the changes in gene translation and transcription in YTHDF3‐KD oocytes and control oocytes. The Pearson correlation coefficient = −0.196. e) Cumulative distribution of total RNA expression (log2 TPM); the red line denotes the control group, and the blue line represents the YTHDF3‐KD group. f) Cumulative distribution of TE. The red line denotes the control group, and the blue line represents the YTHDF3‐KD group. g) Scatter plot showing the RNA TE alterations of YTHDF3‐KD oocytes compared with the control group. Red and blue dots denote up‐ and down‐regulated genes, respectively. Upregulated, FC>1.5; downregulated, FC<0.67. h) Gene set enrichment analysis of TE showing the TE downregulated genes enriched in the hallmark of the G2/M checkpoint and TE upregulated genes enriched in the hallmark of oxidative phosphorylation. i) Bar plots showing the numbers of high‐TE genes (TE>2) and low‐TE genes (TE<0.5) in the YTHDF3‐KD group and the control group oocytes, respectively. PB1, polar body‐1. TE, translational efficiency. FC, fold change. YTHDF3‐KD, YTHDF3 knockdown. Ns, no significant difference. *p < 0.05, ****p < 0.0001.
