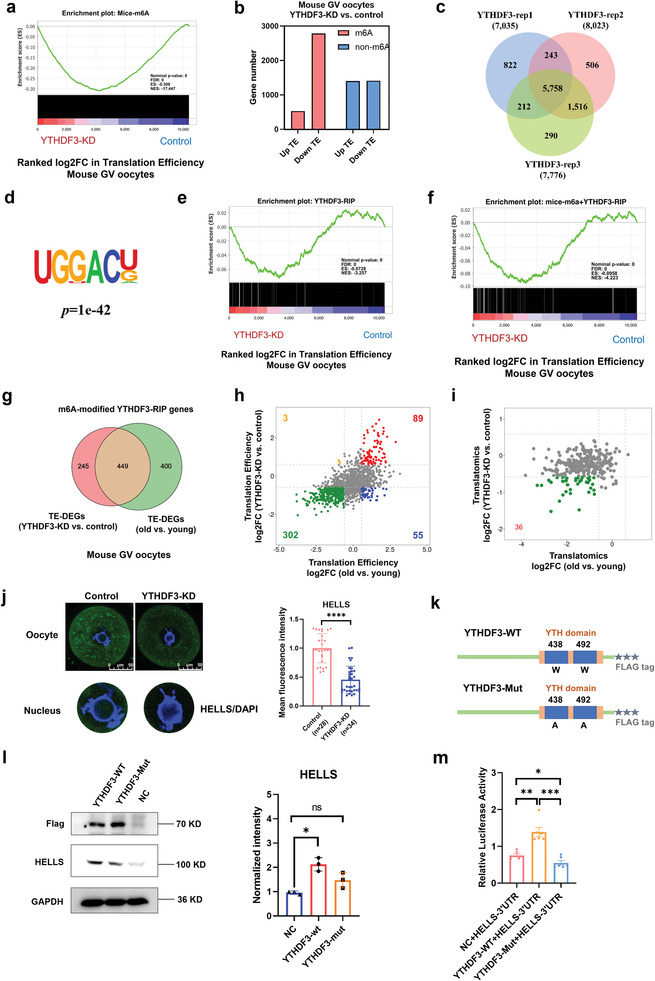
Figure 5.

YTHDF3 modulates RNA translation efficiency in an m6A‐dependent manner. a) Gene set enrichment analysis demonstrating that the TE of m6A‐enriched RNA was significantly decreased upon YTHDF3 depletion. b) Bar plots showing the numbers of up‐ (FC>1.5) and down‐regulated (FC<0.67) genes for m6A‐enriched genes or genes not enriched by m6A, respectively. Pink denotes m6A‐enriched genes. Blue denotes genes not enriched by m6A. c) Venn diagram portraying the overlap of YTHDF3 target genes among three independent RIP‐seq biological replicates. d) Motif identified by HOMER within YTHDF3 RIP‐seq peaks in HEK293T cells. e) Gene set enrichment analysis showing the TE alterations of YTHDF3‐binding RNA upon YTHDF3 depletion. f) Gene set enrichment analysis showing the TE alterations of m6A‐enriched YTHDF3‐binding RNA upon YTHDF3 depletion. g) Venn diagram showing the overlap of m6A‐modified YTHDF3 target genes between the differential TE genes in YTHDF3‐KD oocytes and the differential TE genes in aged mouse oocytes. h) The RNA TE log2fold change in the 449 overlapping genes (described in g) in aged mouse oocytes and YTHDF3‐depleted oocytes. i) The RNA translational level changes in 302 downregulated TE genes (described in h) in aged mouse oocytes and YTHDF3‐depleted oocytes. j) Immunofluorescence verifying the expression of HELLS in the control group and the YTHDF3‐depleted group oocytes. Scale bar, 50 µm. A screenshot of the nucleus is shown separately at the bottom. The right panel shows the quantification of the HELLS protein level. The average intensity of the control group oocytes was set as 1.0. Each dot represents a single oocyte analyzed. p‐Value was calculated with two‐tailed Mann‐Whitney test. k) Schematic representation of wild‐type (YTHDF3‐WT) and mutant (YTHDF3‐Mut) YTHDF3 constructs. l) Western blot demonstrating the expression of HELLS in HEK293T cells transfected with empty vector or wild‐type or mutant Flag‐tagged YTHDF3 plasmid. GAPDH was used as the negative control. The left panel presents a representative Western blot image. The right panel shows the quantification of the HELLS protein level. The average intensity of the NC group was set as 1.0. Each dot represents a single biological replicate. p‐Value was calculated with two‐tailed Mann–Whitney test. m) HEK293T cells were cotransfected with NC, YTHDF3‐WT, or YTHDF3‐Mut plasmids, and luciferase reporter plasmids carrying the HELLS 3’UTR, and luciferase activity was measured. p‐Value was calculated with two‐tailed Mann–Whitney test. TE, translational efficiency. FC, fold change. HOMER, Hypergeometric Optimization of Motif EnRichment. RIP, RNA immunoprecipitation. YTHDF3‐KD, YTHDF3 knockdown. NC, negative control. Ns, no significant difference. *p < 0.05, **p < 0.01, ***p < 0.001, ****p < 0.0001.
