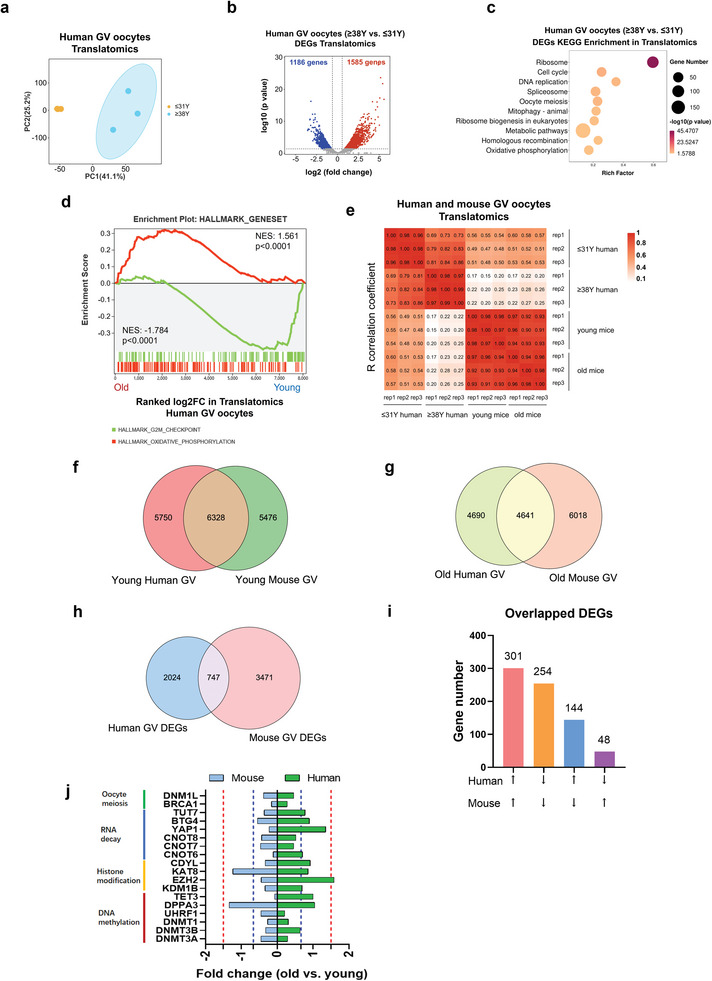
Figure 6.

The transcriptional and translational landscapes of aged human oocytes. a) PCA plot of the translatomics of oocytes from young and aged human females. b) Volcano diagram showing DEGs detected by ultrasensitive translatomics. Red and blue dots denote up‐ and down‐regulated genes, respectively. p < 0.05, FC>1.5 or <0.67. c) Representative KEGG enrichment of DEGs identified by translatomics in aged human oocytes. d) Gene set enrichment analysis of the translatomics showing the translationally downregulated genes enriched in the hallmark of the G2/M checkpoint and translationally upregulated genes enriched in the hallmark of oxidative phosphorylation. e) Heatmap depicting the Pearson correlation coefficient of the translatome between each biological replicate from young and aged mice/humans. f) Venn plot of detected genes generated by single‐cell translatomics (TPM>1 for any biological replicate) in young human oocytes (≤31 years old) and in young mouse oocytes (≈4 weeks old). g) Venn plot of detected genes generated by single‐cell translatomics (TPM>1 for any biological replicate) in aged human oocytes (≥38 years old) and in aged mouse oocytes (>16 months old). h) Venn diagram showing the overlap of DEGs in aged mouse/human GV oocytes detected from the ultrasensitive translatomics (FC<0.67 or >1.5). i) The numbers of overlapped DEGs in aged human and aged mouse oocytes. j) The fold changes of specific genes in aged human and aged mouse oocytes. PCA, principal component analysis. FC, fold change. TPM, transcripts per million. DEGs, differentially expressed genes. KEGG, Kyoto Encyclopedia of Genes and Genomes.
