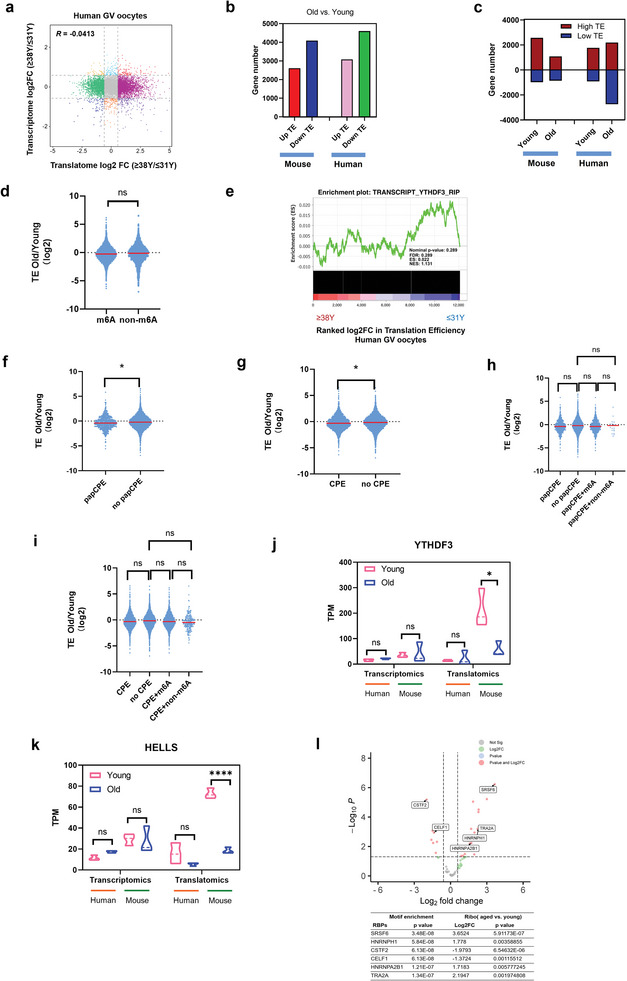
Figure 7.

The changes of RNA translation efficiency in aged human oocytes. a) Scatter plot showing the changes in gene translation and transcription during oocyte aging. b) Bar plots showing the numbers of upregulated TE genes and downregulated TE genes in young and aged mouse/human GV oocytes, respectively. Upregulated, FC>1.5; downregulated, FC<0.67. c) Bar plots showing the numbers of high‐TE genes (TE>2) and low‐TE genes (TE<0.5) in young and aged mouse/human GV oocytes, respectively. d) Violin plots showing the TE changes in the genes of the group not enriched by m6A and of the m6A‐enriched group in aged human oocytes compared with young human oocytes. p‐Value was calculated with Student's t‐test for independent samples. e) Gene set enrichment analysis demonstrating the correlation of TE alterations and YTHDF3 target RNA in aged human oocytes. f) Violin plots showing the TE changes in genes of the papCPE‐containing group and in genes of the group not containing papCPE in aged human oocytes compared with young human oocytes. p‐Value was calculated with Student's t‐test for independent samples. g) Violin plots showing the TE changes in genes of the CPE‐containing group and in genes of the group not containing CPE in aged human oocytes compared with young human oocytes. p‐Value was calculated with Student's t‐test for independent samples. h) Violin plots showing the TE changes in four groups of genes in aged human oocytes compared with young human oocytes. p‐Values were calculated with one‐way ANOVA and Bonferroni post hoc test. i) Violin plots showing the TE changes in four groups of genes in aged human oocytes compared with young human oocytes. p‐Values were calculated with one‐way ANOVA and Bonferroni post hoc test. j) Transcriptional and translational expression levels of the YTHDF3 in human/mouse GV oocytes. Data are shown as the mean ± SEMs. p‐Values were calculated with Student's t‐test for independent samples. k) Transcriptional and translational expression levels of the HELLS in human/mouse GV oocytes. Data are shown as the mean ± SEMs. p‐Values were calculated with Student's t‐test for independent samples. l) Representative RBPs enriched in 3’UTR of the genes in human oocytes that potentially regulated RNA TE. Data are shown as the means±SEMs. p‐Values were calculated with Student's t‐test for independent samples. FC, fold change. TE, translational efficiency. CPEs, cytoplasmic polyadenylation elements. papCPE, CPEs within 100 bp of PASs. RBPs, RNA binding proteins. Ns, no significant difference. *p < 0.05, **p < 0.01, ****p < 0.0001.
