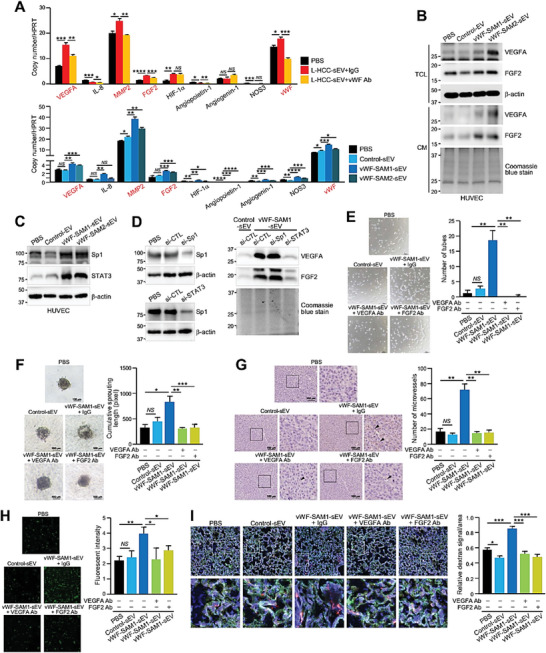
Figure 5.

sEV–vWF modulates endothelial cells via elevated levels of VEGF‐A and FGF2. A) Quantitative PCR of proangiogenic genes in HUVECs treated with L‐HCC‐sEVs together with anti‐IgG or anti‐vWF antibody (upper panel) and HUVECs treated with control‐ and vWF‐SAM‐sEVs (lower panel) (n = 3). B) Western blotting of VEGF‐A and FGF2 expressions in the total cell lysate (TCL) and conditioned medium (CM) of HUVECs treated with control‐ and vWF‐SAM‐sEVs. C) Expressions of Sp1 and STAT3 in HUVECs treated with control‐ and vWF‐SAM‐sEVs were analyzed by immunoblotting. D) HUVECs transiently transfected with siRNA against Sp1 and STAT3 and subjected to western blot analysis (left panel). HUVECs transiently transfected with si‐Sp1 and si‐STAT3 and treated with vWF‐SAM‐sEVs were analyzed by western blot analysis (right panel). E) Tube formation (n = 3), F) endothelial sprouting (n = 5), and G) in vivo Matrigel plug angiogenesis (n = 3) assays were performed using HUVECs treated with control‐ and vWF‐SAM‐sEVs in the presence of either control IgG, anti‐VEGF‐A, or anti‐FGF2 antibody. H) Tumor–endothelial adhesion assays using PLC/PRF/5 cells and HUVECs treated with control and vWF‐enriched sEVs together with either control IgG, anti‐VEGF‐A, or anti‐FGF2 antibody (n = 3). I) Fluorescent image showing the vascular permeability of mouse lungs after intravenous co‐injection of Texas Red‐Dextran, FITC‐Lectin, and vWF‐enriched sEVs with antibodies against VEGF‐A or FGF2 (n = 3 or 15 mice in total). The Texas Red signal was quantified. Data are presented as the mean ± SEM. *P < 0.05, **P < 0.01; ***P < 0.001; and ****P < 0.0001. P < 0.05 was regarded as statistically significant. NS, not significant.
