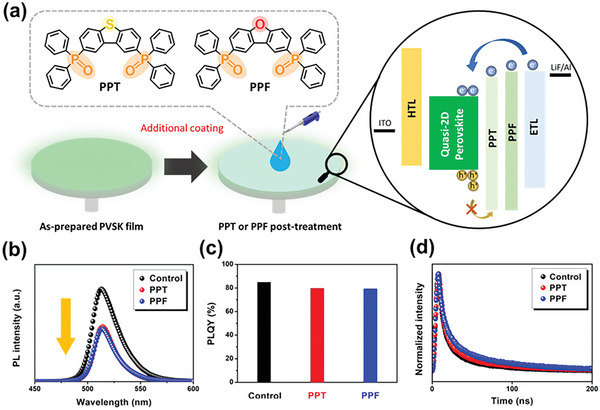
Figure 1.

a) Chemical structures of PPT and PPF and schematic representation of the post‐treatment process and illustration of the interfacial engineering. b) PL emission spectra, c) PLQYs, and d) TRPL curves of pristine, PPT‐treated and PPF‐treated perovskite films, where the PLQYs were measured by a 368 nm laser.
