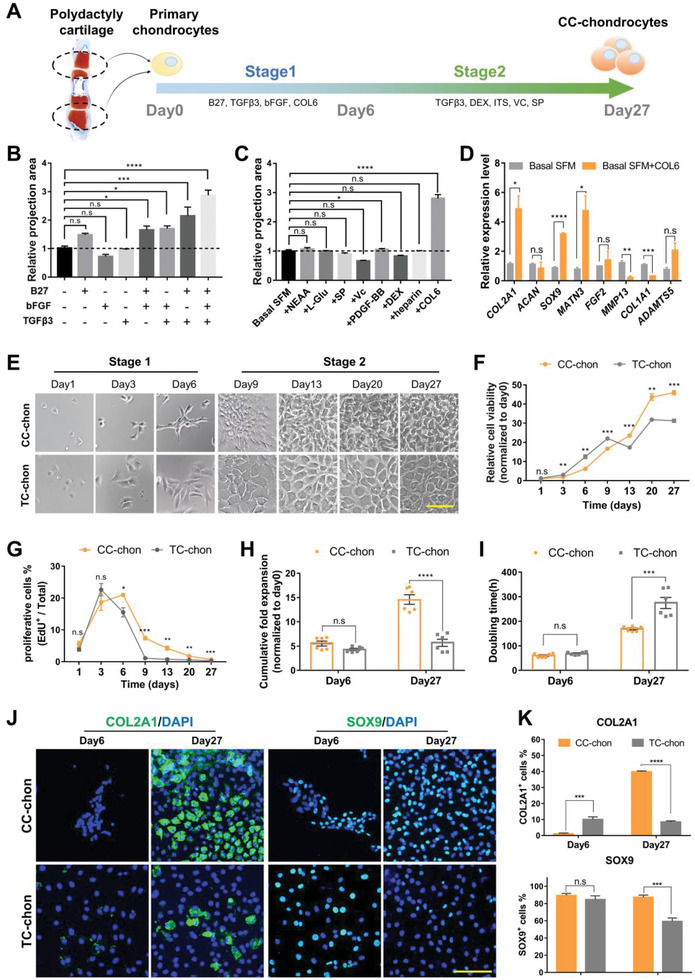
Figure 1.

The customized culture enables chondrocytes to proliferate and also express lineage markers. A) Schematic overview of the designed program for step‐wise culture. B) The contribution of different combinations of elements to chondrocytes expansion (n = 3, one‐way ANOVA followed by Dunnett's multiple comparison test). C) The contribution of different additives to the optimization of expansion (n = 3, one‐way ANOVA followed by Dunnett's multiple comparison test). D) Gene expression analysis of chondrocytes markers (COL2A1, ACAN, SOX9, MATN3, FGF2, MMP13, COL1A1 and ADAMTS5) in chondrocytes cultured with/without COL6 (n = 3, unpaired two‐tailed Student's t‐tests). E) Representative images of chondrocytes cultured in CC and TC over time. Scale bars: 100 µm. F) Cell viability of CC‐chons and TC‐chons measured by CCK‐8 kit over time (n = 3, unpaired two‐tailed Student's t‐tests). G) Percentage of proliferating cells (EdU+) in CC and TC over time (n = 3, unpaired two‐tailed Student's t‐tests. H) Cumulative fold expansion at day 6 and day 27, normalized to day 0 (n = 6, unpaired two‐tailed Student's t‐tests). I) Doubling time of chondrocytes cultured in CC and TC (n = 6, unpaired two‐tailed Student's t‐tests). J) Representative images of immunofluorescent staining of chondrocyte markers (COL2A1 and SOX9) in CC‐chons and TC‐chons. Scale bars: 100 µm. K) Efficiency quantification of COL2A1 and SOX9 staining in CC‐chons and TC‐chons at day 6 and day 27, respectively (n = 6, unpaired two‐tailed Student's t‐tests). All data were mean ± SEM. n.s p ≥ 0.05, *p < 0.05, **p < 0.01, ***p < 0.001, ****p < 0.0001.
