
Figure 4.
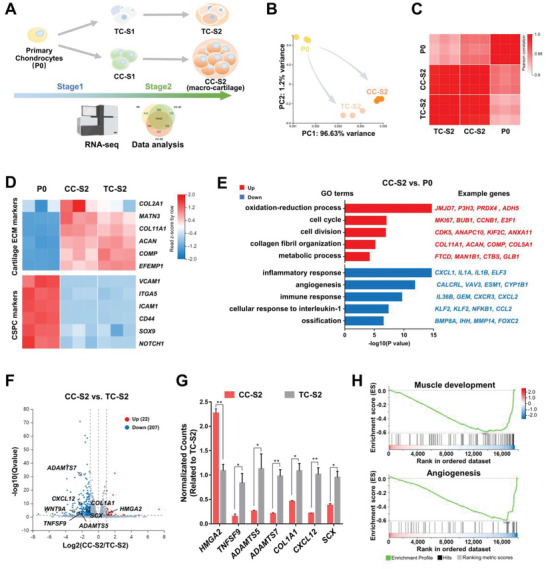
Transcriptomics reveals that the customized culture induces lineage‐specific differentiation with activated metabolism. A) Schematic diagram of transcriptomics workflow. B) Principal‐component analysis (PCA) plot of primary chondrocytes (P0) and end‐stage tissues (CC‐S2, TC‐S2). C) Correlation coefficient matrix of P0, CC‐S2, and TC‐S2. D) Heatmaps of CSPC markers and cartilage markers in P0, CC‐S2, and TC‐S2. E) Gene ontology (GO) enrichment analysis comparison between P0 and CC‐S2. F) Volcano plot identifying genes that are differentially expressed between CC‐S2 and TC‐S2. G) Relative expression of representative differentially expressed genes in CC‐S2 and TC‐S2 (n = 3, unpaired two‐tailed Student's t‐tests). H) Gene set enrichment analysis (GSEA) enrichment analysis comparison between CC‐S2 and TC‐S2. All data were mean ± SEM. *p < 0.05, **p < 0.01.