
Figure 6.
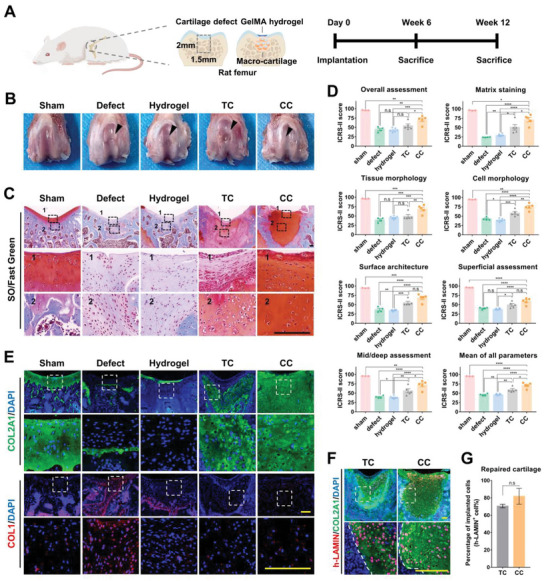
CC macro‐cartilage maintains lineage phenotype and promotes cartilage repair in vivo. A) Schematic diagram of macro‐cartilage implantation in critical‐sized cartilage defects. B) Overall repair of cartilage defects 12 weeks after implantation. C) Representative images of repaired cartilage stained by SO/fast green. Scale bar: 200 µm. D) ICRS‐II scoring for histological assessment of repaired cartilage (n = 3–6, one‐way ANOVA followed by Tukey's multiple comparison test). E) Immunofluorescence staining of repaired cartilage for detection of COL2A1 and COL1. Scale bar: 200 µm. F) Immunofluorescence staining of implanted chondrocyte for detection of human LAMIN in repaired cartilage. Scale bar: 200 µm. G) Quantification of chondrocytes derived from implanted macro‐cartilage in repaired cartilage (n = 3, unpaired two‐tailed Student's t‐tests). All data were mean ± SEM. n.s p ≥ 0.05, *p < 0.05, **p < 0.01, ***p < 0.001, ****p < 0.0001.