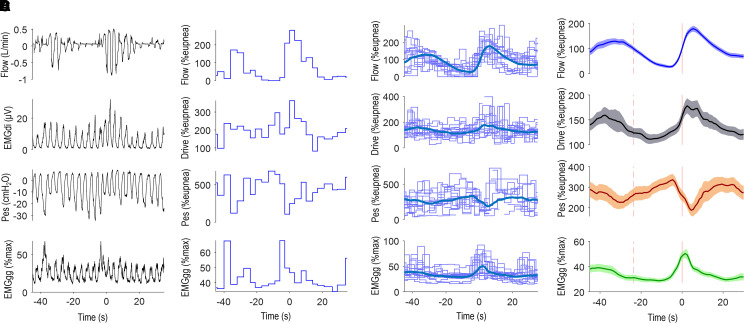
Figure 2.
Analysis of respiratory signals. (A) Example flow, diaphragm electromyography (EMGdi), esophageal pressure (Pes), and peak genioglossus activity (EMGgg) signals during a respiratory event in an example patient. Note that during the event, negative pressure swings increase progressively with obstruction, but EMGdi swings first fall and then rise later in the event. (B) For the same period, breath-by-breath values of ventilation (VE; presented as percentage eupnea %eupnea), drive (peak minus initial EMGdi swing, normalized by the ratio of EMGdi to VE during wakefulness breaths, presented as %eupnea), pressure (peak minus initial Pes swing, normalized by the ratio of Pes to VE during wakefulness breaths, presented as %eupnea), and EMGgg (peak EMGgg value, presented as %max). (C and D) For each signal, breath-by-breath data from all events were aligned at event termination (every fifth event is plotted for clarity) and ensemble averaged to provide a mean time course for each subject (C, thick blue line), also shown in D with shaded 95% confidence interval region. %max = percentage maximum.

