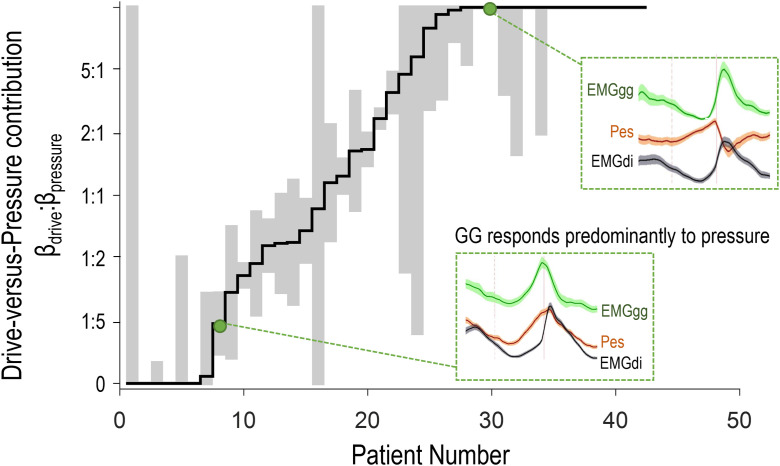
Figure 4.
Individual data demonstrating the prevalence of patients whose genioglossus activity (EMGgg) during events is predominantly explained by drive (high drive-vs.-pressure contribution, i.e., βdrive:βpressure > 2:1; n = 22 of 42), by pressure (low drive-vs.-pressure contribution, i.e., βdrive:βpressure < 1:2; n = 11 of 42), or by a more balanced combination of both drive and pressure stimuli (βdrive similar to βpressure; n = 9). Inset plots show the signal time course of EMGgg compared with esophageal pressure (Pes) and drive diaphragm electromyography (EMGdi) stimuli during events for two representative example patients (as per Figure 2). Note that EMGgg closely tracks EMGdi in patient number 30 (high drive-versus-pressure contribution) and closely tracks Pes in patient 8 (low drive-vs.-pressure contribution). Gray bars (indicating 95% confidence interval) demonstrate that for most individuals, separate drive-versus-pressure contributions to EMGgg could be differentiated using multivariable regression. βdrive describes the association between EMGgg and drive (standardized coefficient, adjusting for pressure); βpressure describes the association between EMGgg and pressure (adjusting for drive).

