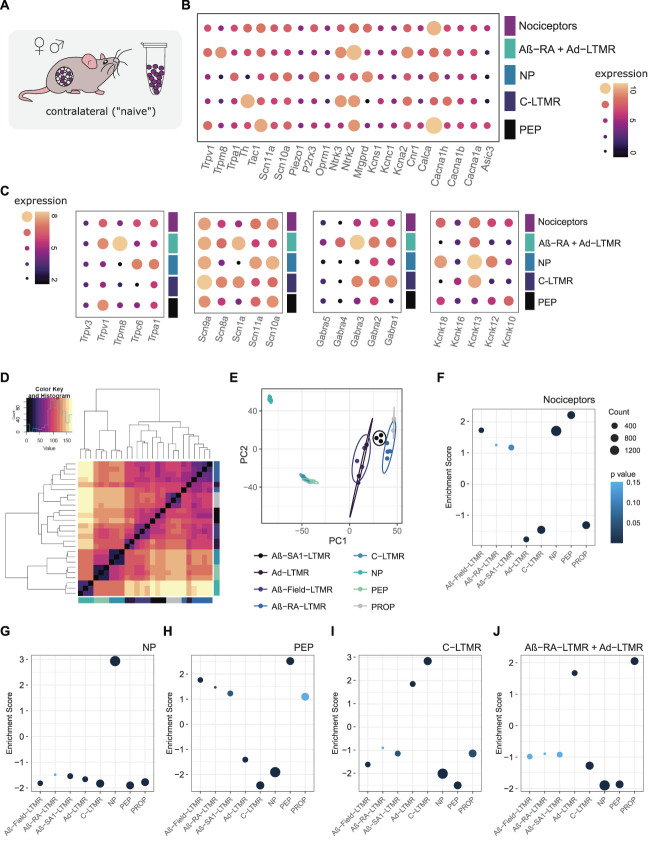
Figure 2.
RNA-seq validation against previously published work, combining male + female samples. (A) Contralateral tissue was compared with previously published naïve data sets. (B) Hallmark gene expression across contralateral samples. Expression plotted as VST transformed count data. (C) Ion channel expression across contralateral samples. (D and E) Zheng et al. 2019 naïve subpopulation clustering (mixed sex). (F–J) Subtype enrichment against gene sets derived from Zheng et al. 2019 (see methods for details, gene sets provided in Supplemental Digital Content, Table 3, available at http://links.lww.com/PAIN/B826). (F) Nociceptors, (G) peptidergic nociceptors, (H) nonpeptidergic nociceptors, (I) C-LTMRs, and (J) Aβ-RA + Aδ-LTMRs. Plotted as normalized enrichment scores, coloured by P-value. Full lists of scores and P-values are available in Supplemental Digital Content, Table 2, available at http://links.lww.com/PAIN/B825. C-LTMRs, C low-threshold mechanoreceptors; NP, nonpeptidergic; PEP, peptidergic; PROP, proprioceptors; VST, variance stabilizing transformation.

