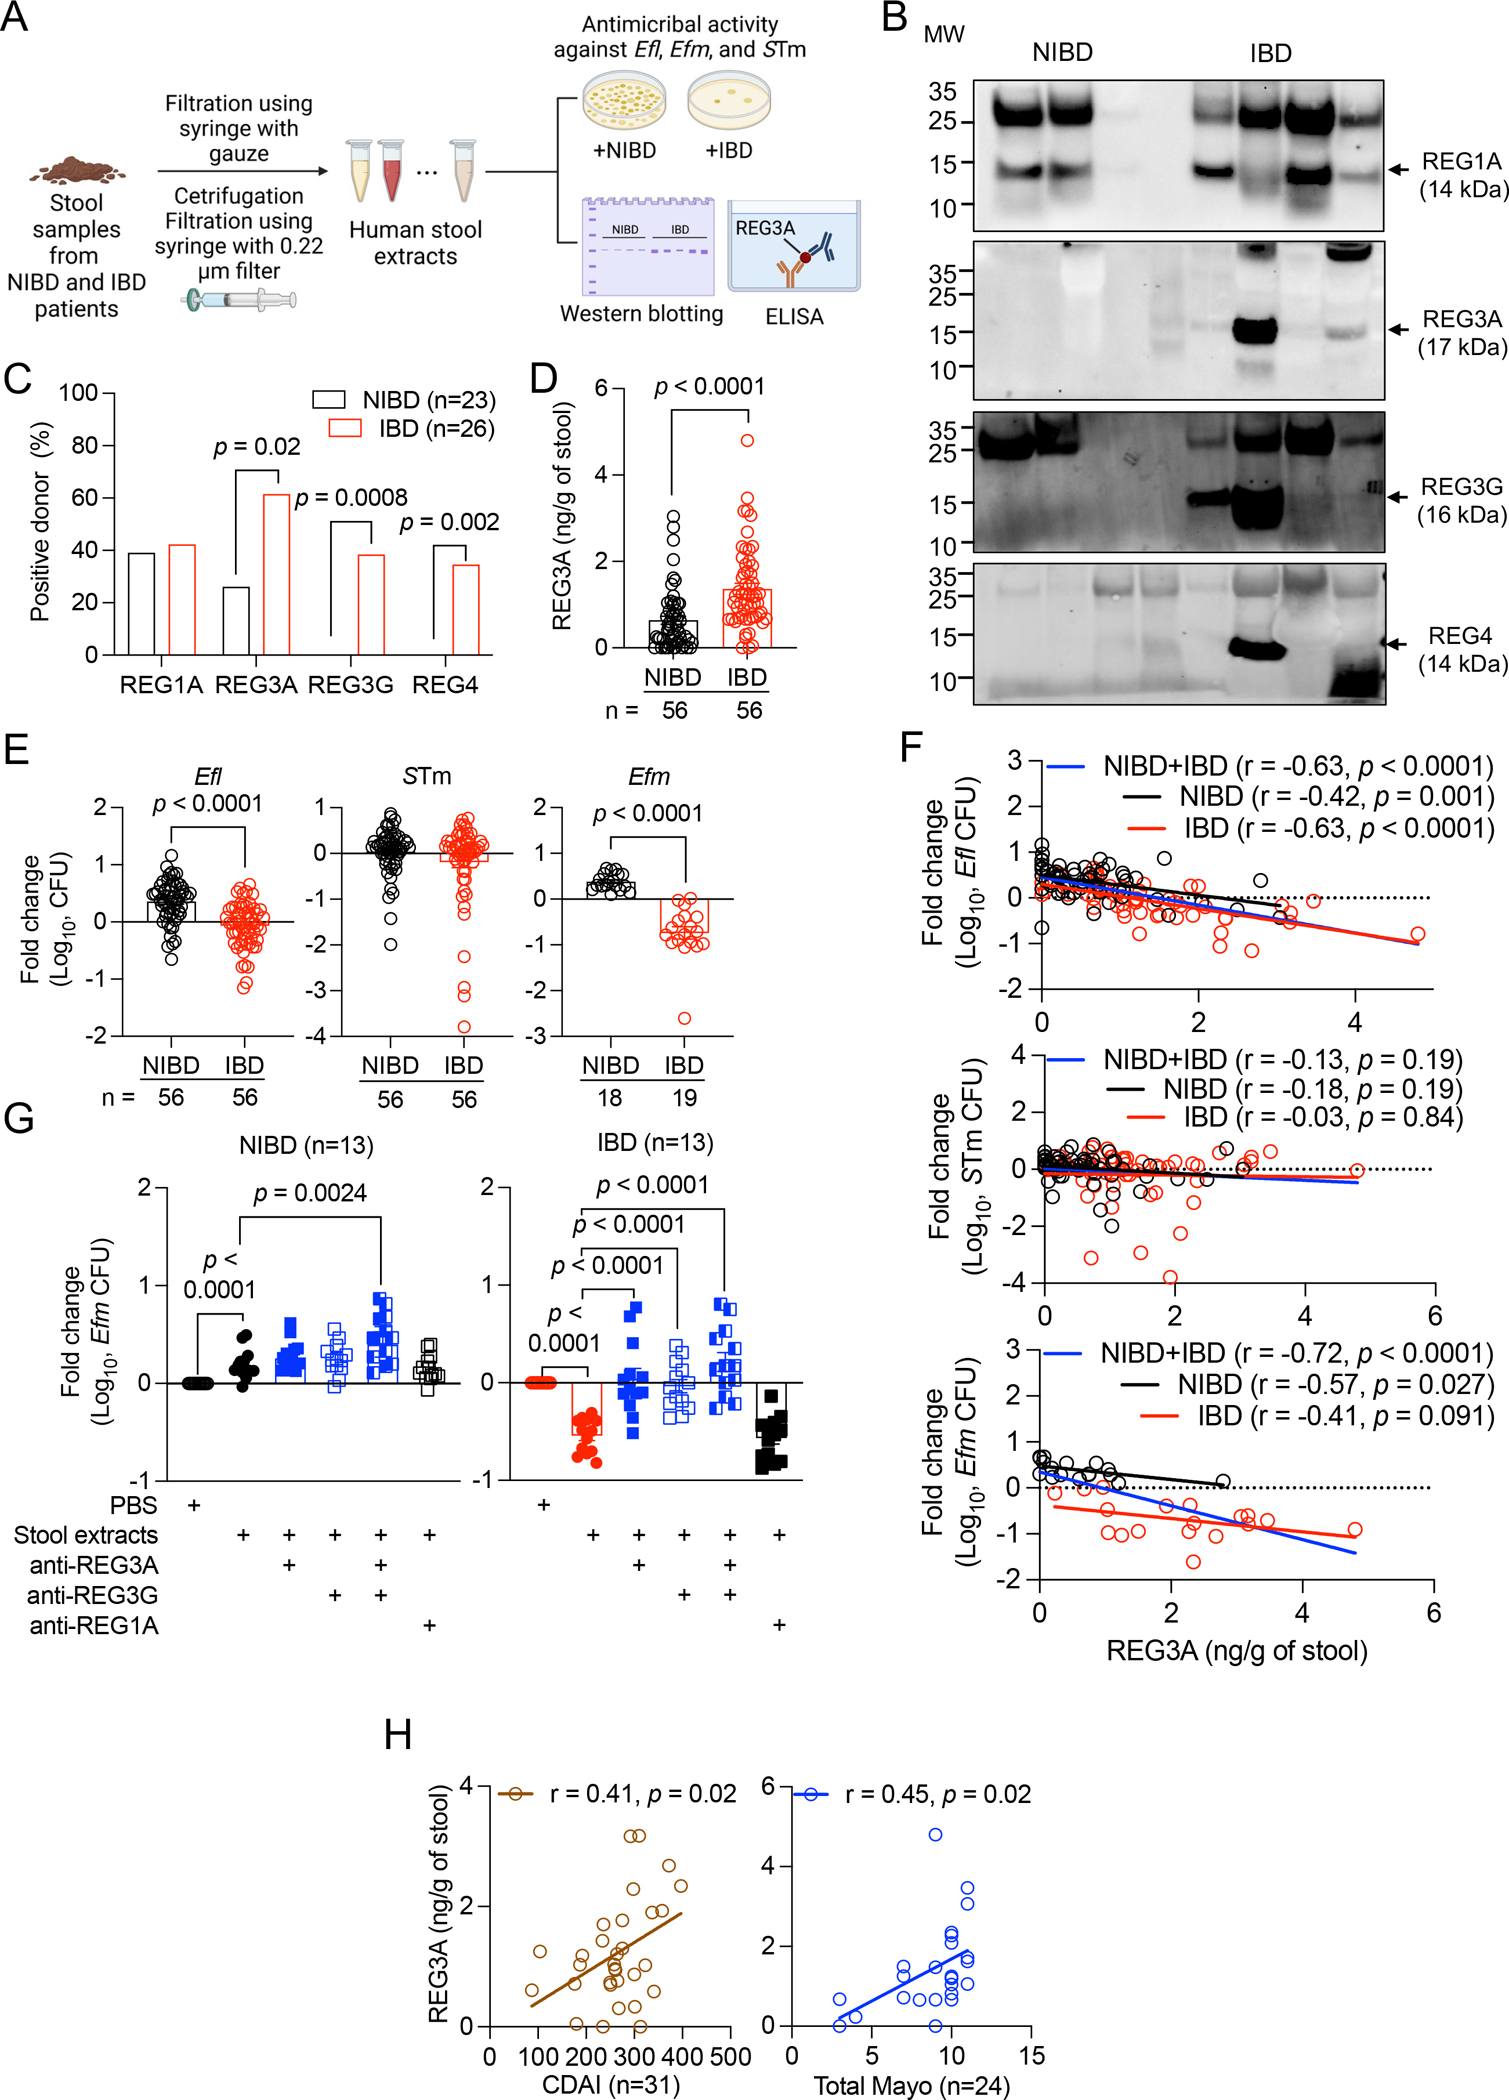
Figure 1. Increased REG3A and REG3G in IBD patient stool inhibit Enterococcus.

A) Schematic of stool extract preparation and analysis. B) Western blots of REG1A, REG3A, REG3G, and REG4 in stool extracts from representative 3 non-IBD (NIBD) and 5 IBD patients. C) Proportion of specimens from NIBD and IBD patients in which REG1A, REG3A, REG3G, or REG4 were detectable by western blot. D) Quantification of REG3A in NIBD and IBD stool extracts by ELISA. E) Fold changes in colony forming unit (CFU) of Enterococcus faecalis (Efl) and Salmonella Typhimurium (STm) cultured in NIBD and IBD stool extracts. Results obtained with Efl were confirmed with E. faecium (Efm). F) Correlation between REG3A concentration and CFU fold changes of Efl (upper), STm (middle), and Efm (lower) cultured in NIBD and IBD stool extract. G) Fold change in Efm CFU cultured in PBS or NIBD (left) and IBD (right) stool extracts in the presence of indicated antibodies. H) Correlation between REG3A concentration and Crohn’s disease activity index (CDAI) for CD patients or total Mayo score for ulcerative colitis (UC) patients. Data points in D-H represent individual patients. Bars represent mean ± SEM and at least three independent experiments were performed. r, Pearson correlation coefficient. Indicated p values by Fisher’s exact test in C, unpaired t test, two-tailed in D, E, and G, and simple linear regression analysis in F and H. See also Figure S1 and Tables S1–S3.
