
Figure 3. Enterococcus protects against intestinal injury through NOD2.
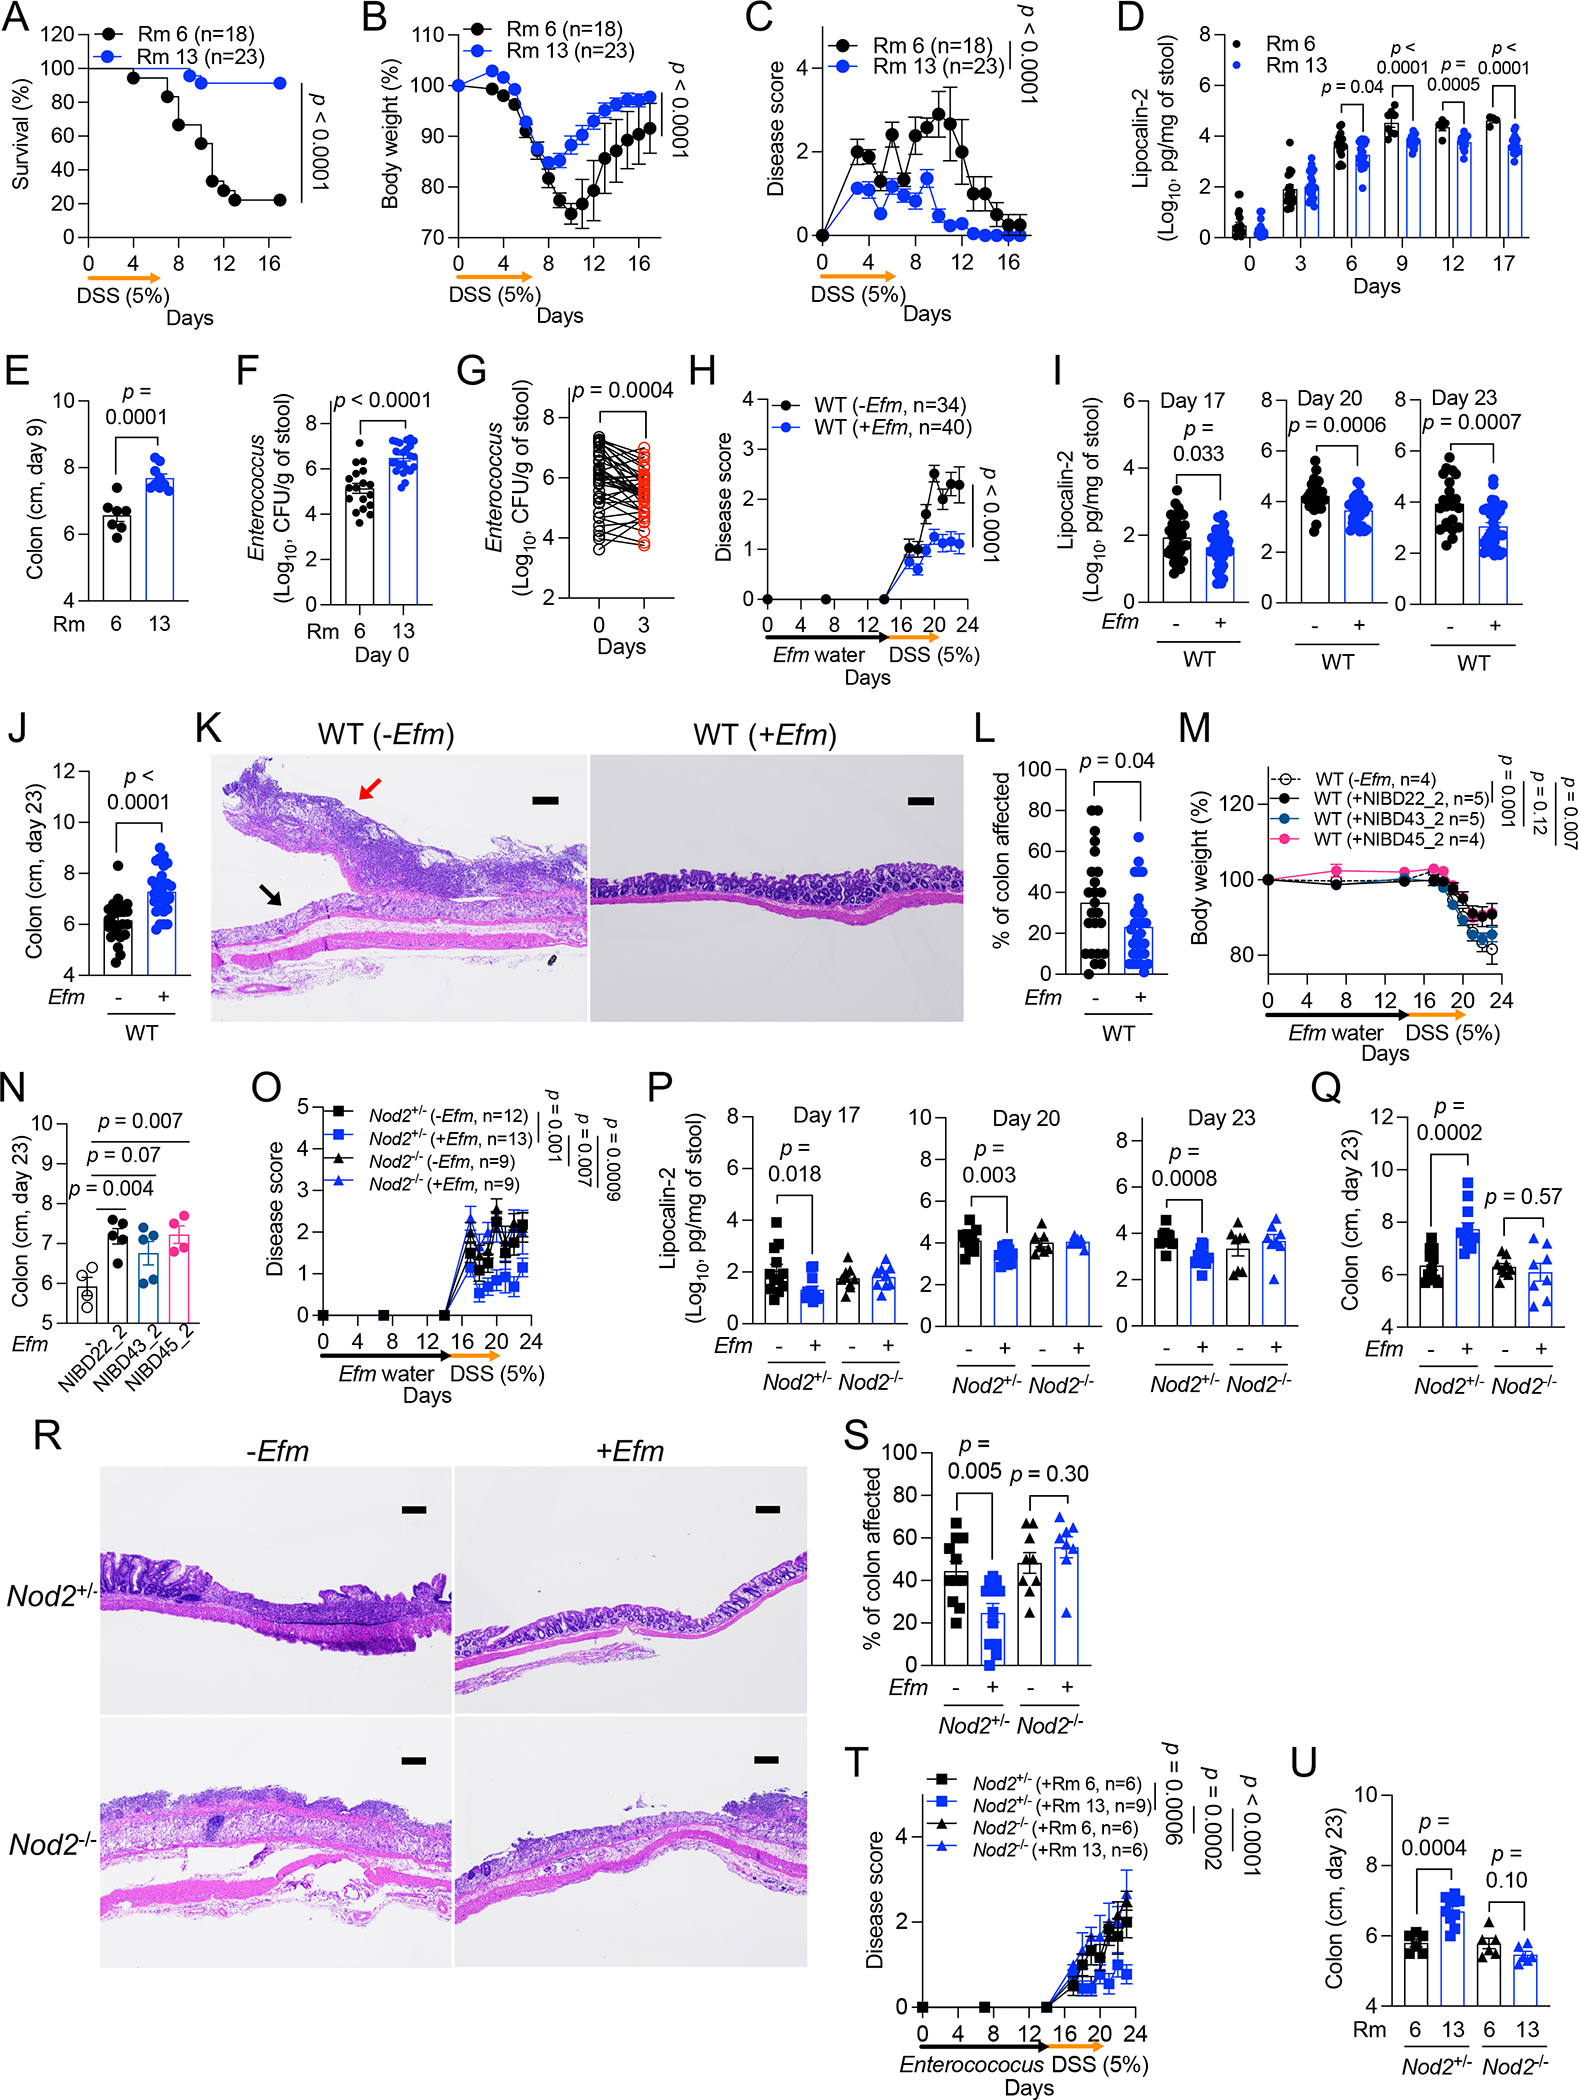
A-G) Dextran sulfate sodium (DSS)-induced intestinal injury of wild-type (WT) B6 mice bred in room 6 (Rm 6) or 13 (Rm 13). Mice were examined for survival (A), changes in body weight (B) disease score (C), fecal lipocalin-2 (LCN2) (D), colon length on day 9 (E), endogenous Enterococcus burden on day 0 (F), and changes in Enterococcus burden on day 3 (G). H-L) DSS treatment of WT mice from Rm 6 following administration of Efm or control. Mice were examined for changes in disease score (H), fecal LCN2 (I), and colon length on day 23 (J). Representative images of hematoxylin and eosin (H&E)-stained sections of the colon (K) and quantification of the proportion of colon affected (L). Black arrow indicates destroyed colonic epithelium replaced with a diffuse ulcer and pus; red arrow indicates acute inflammation with primary neutrophils, lymphocytes, plasma cells, and dead cell debris. Breakdown of histological measurements by individual mice is provided in Table S4 for this and other figures. M and N) Body weight change (M) and colon length on day 23 (N) after DSS treatment of WT mice from Rm 6 following administration of Efm isolates from NIBD patients. O-S) DSS treatment of Nod2+/− and Nod2−/− mice from Rm 6 following administration of Efm or control. Mice were examined for changes in disease score (O), fecal LCN2 at indicated time points (P), and colon length on day 23 (Q). Representative images of H&E-stained sections of the colon (R) and quantification of the proportion of colon affected (S). T and U) Disease score (T) and colon length on day 23 (U) after DSS treatment of Nod2+/− and Nod2−/− mice following administration of Enterococcus isolated from Rm 6 or Rm 13. Bars, 200 μm. Data points in D-G, I, J, L, N, P, Q, S, and U represent individual mice. Data points in B, C, H, M, O, and T represent mean ± SEM. Bars represent mean ± SEM from at least two independent experiments. Indicated p values by log-rank Mantel-Cox test in A, two-way ANOVA test in B, C, H, M, O, and T, unpaired t test, two-tailed in D-F, I, J, L, N, P, Q, S, and U, and paired t test, two-tailed in G. See also Figures S2 and S3 and Table S4.