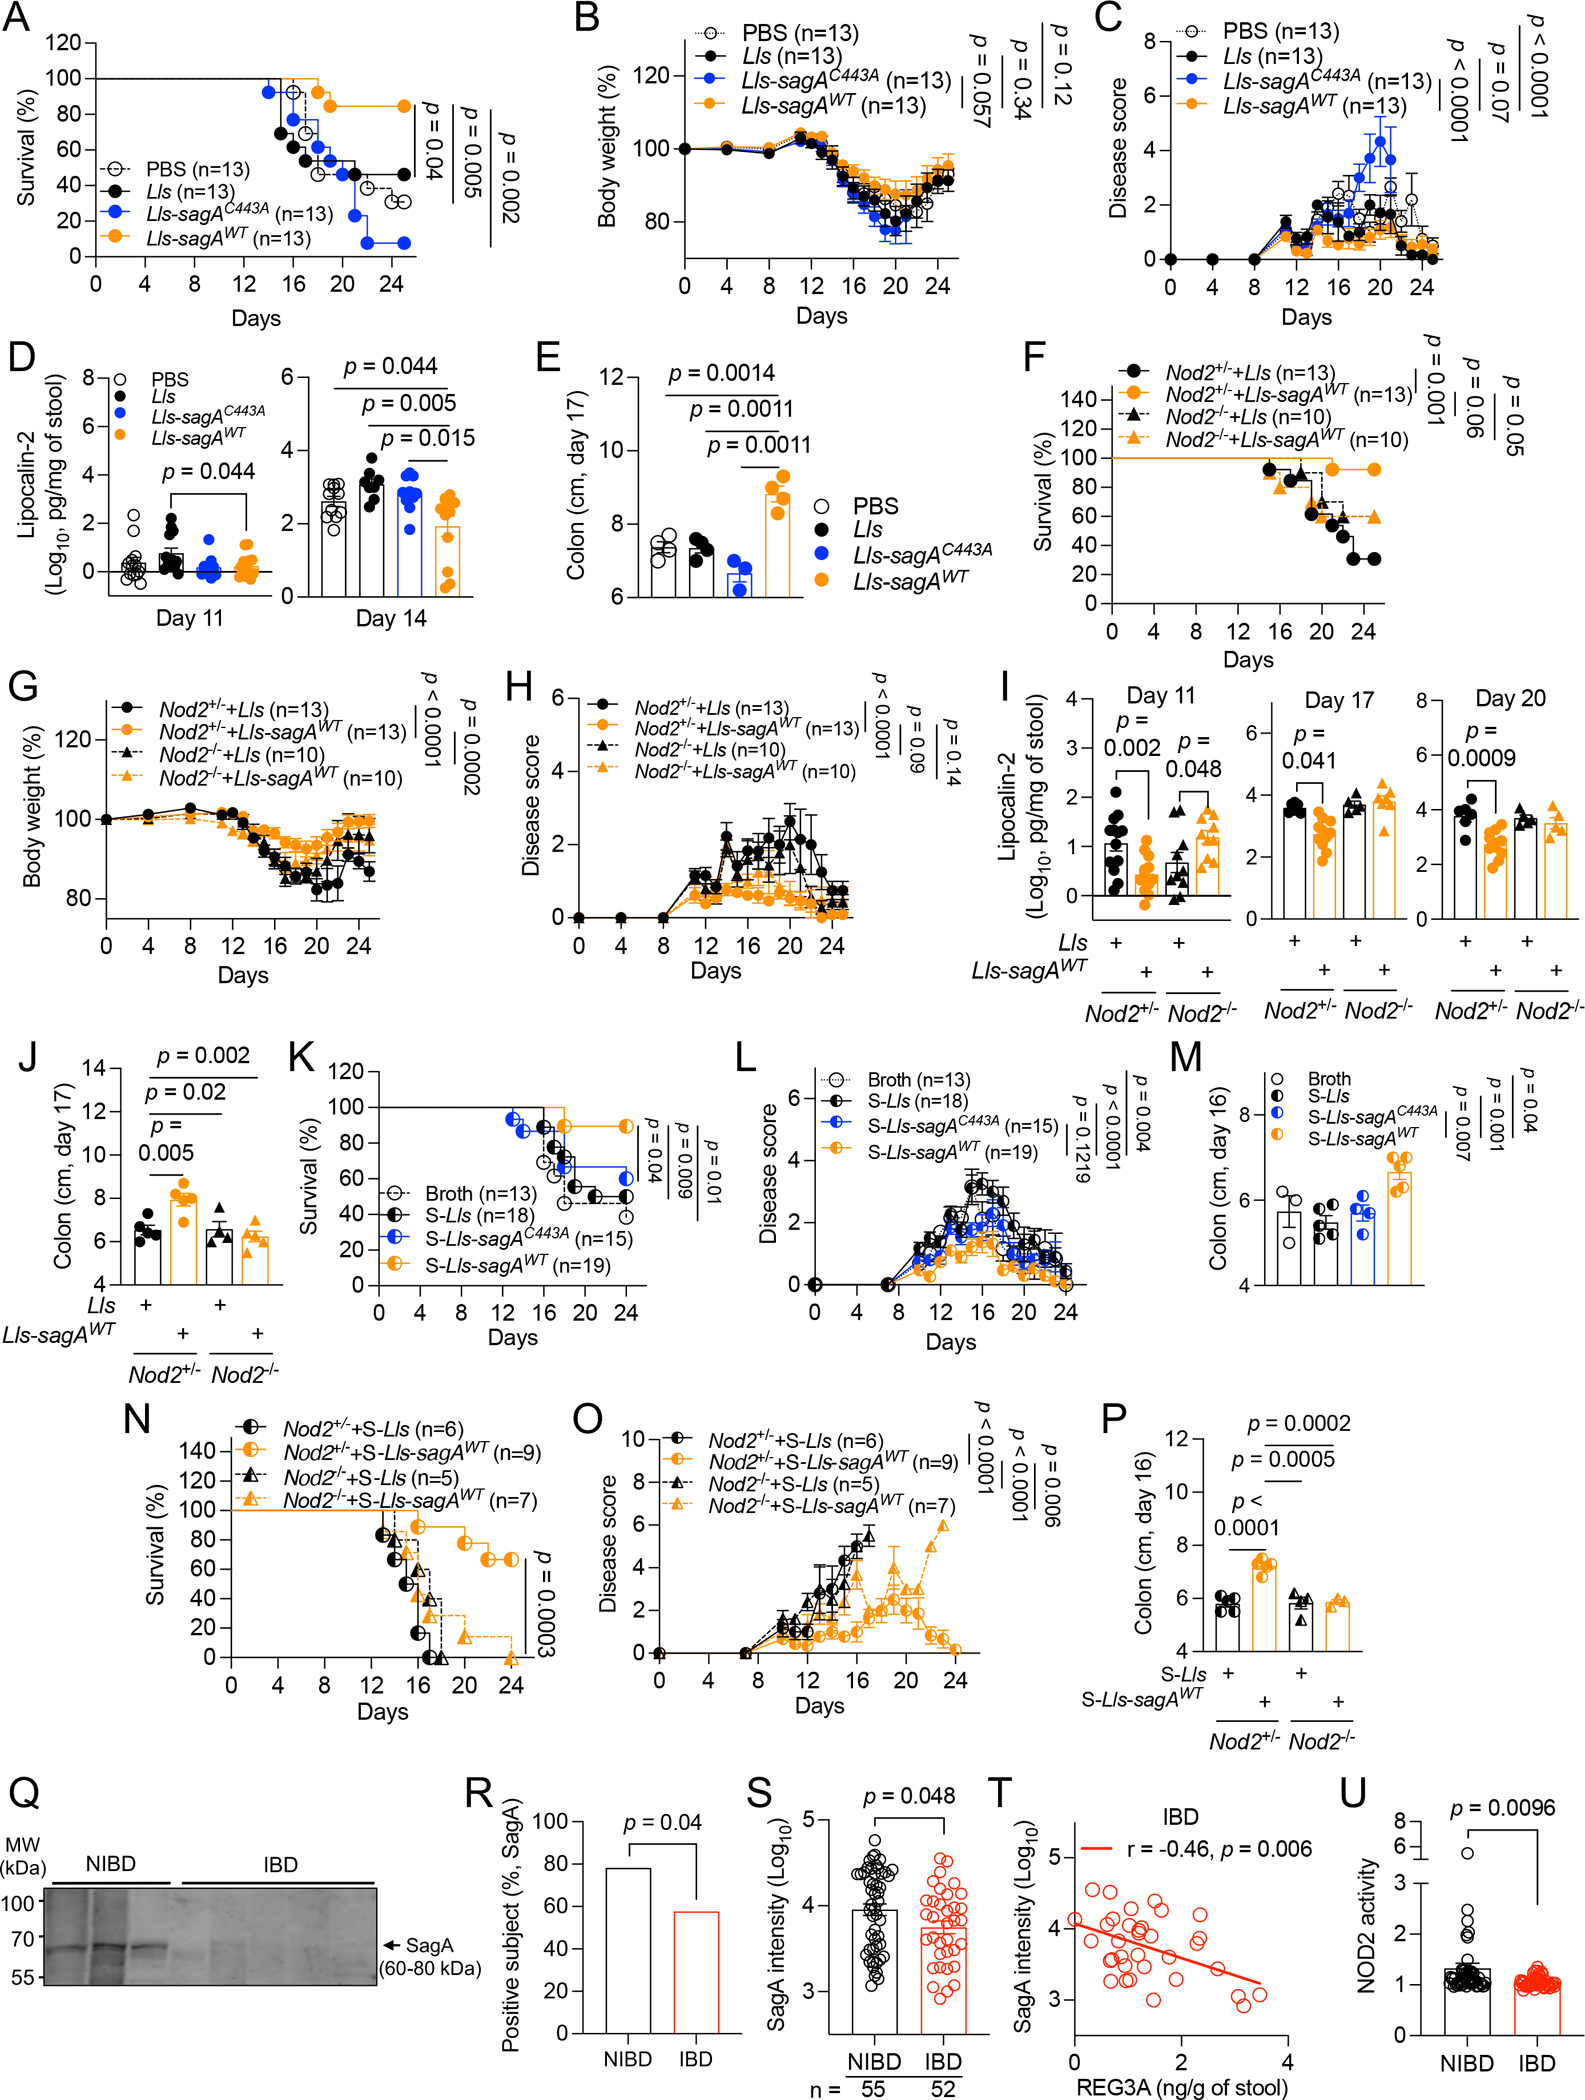
Figure 4. SagA mediates NOD2-dependent protection against intestinal injury.

A-E) Antibiotics (abx)-treated WT mice orally inoculated with PBS, Lactococcus lactis (Lls), Lls-sagAWT, or Lls-sagAC443A and given DSS were examined for survival (A), changes in body weight (B), disease score (C), fecal LCN2 (D), and colon length on day 17 (E). F-J) Abx-treated Nod2+/− and Nod2−/− mice inoculated with Lls or Lls-sagAWT and given DSS were examined for survival (F), changes in body weight (G) and disease score (H), fecal LCN2 (I), and colon length on day 17 (J). K-M) DSS-treated WT mice receiving broth or culture supernatants of Lls (S-Lls), Lls-sagAWT (S-Lls-sagAWT), or Lls-sagAC443A (S-Lls-sagAC443A) in drinking water were examined for survival (K), changes in disease score (L), and colon length on day 16 (M). N-P) DSS-treated Nod2+/− and Nod2−/− mice receiving S-Lls or S-Lls-sagAWT were examined for survival (N), changes in disease score (O), and colon length on day 16 (P). Q) Western blots of SagA in stool extracts from representative 3 NIBD and 5 IBD patients. R and S) Proportion of NIBD and IBD patients in which SagA was detectable by western blot (R) and band intensity (S). T) Correlation between SagA and REG3A. U) NOD2 activity detected by HEK-Blue NOD2 reporter cells incubated with NIBD and IBD stool extracts. Values represent fold change over background control cells. Data points in D, E, I, J, M, and P represent individual mice. Data points in S-U represent individual patients. Data points in B, C, G, H, L, and O represent mean ± SEM. Bars represent mean ± SEM from at least two independent experiments. r, Pearson correlation coefficient. Indicated p values by log-rank Mantel-Cox test in A, F, K, and N, two-way ANOVA test in B, C, G, H, L, and O, unpaired t test, two-tailed in D, E, I, J, M, P, S, and U, Fisher’s exact test in R, and simple linear regression analysis in T. See also Figure S4 and Tables S1 and S2.
