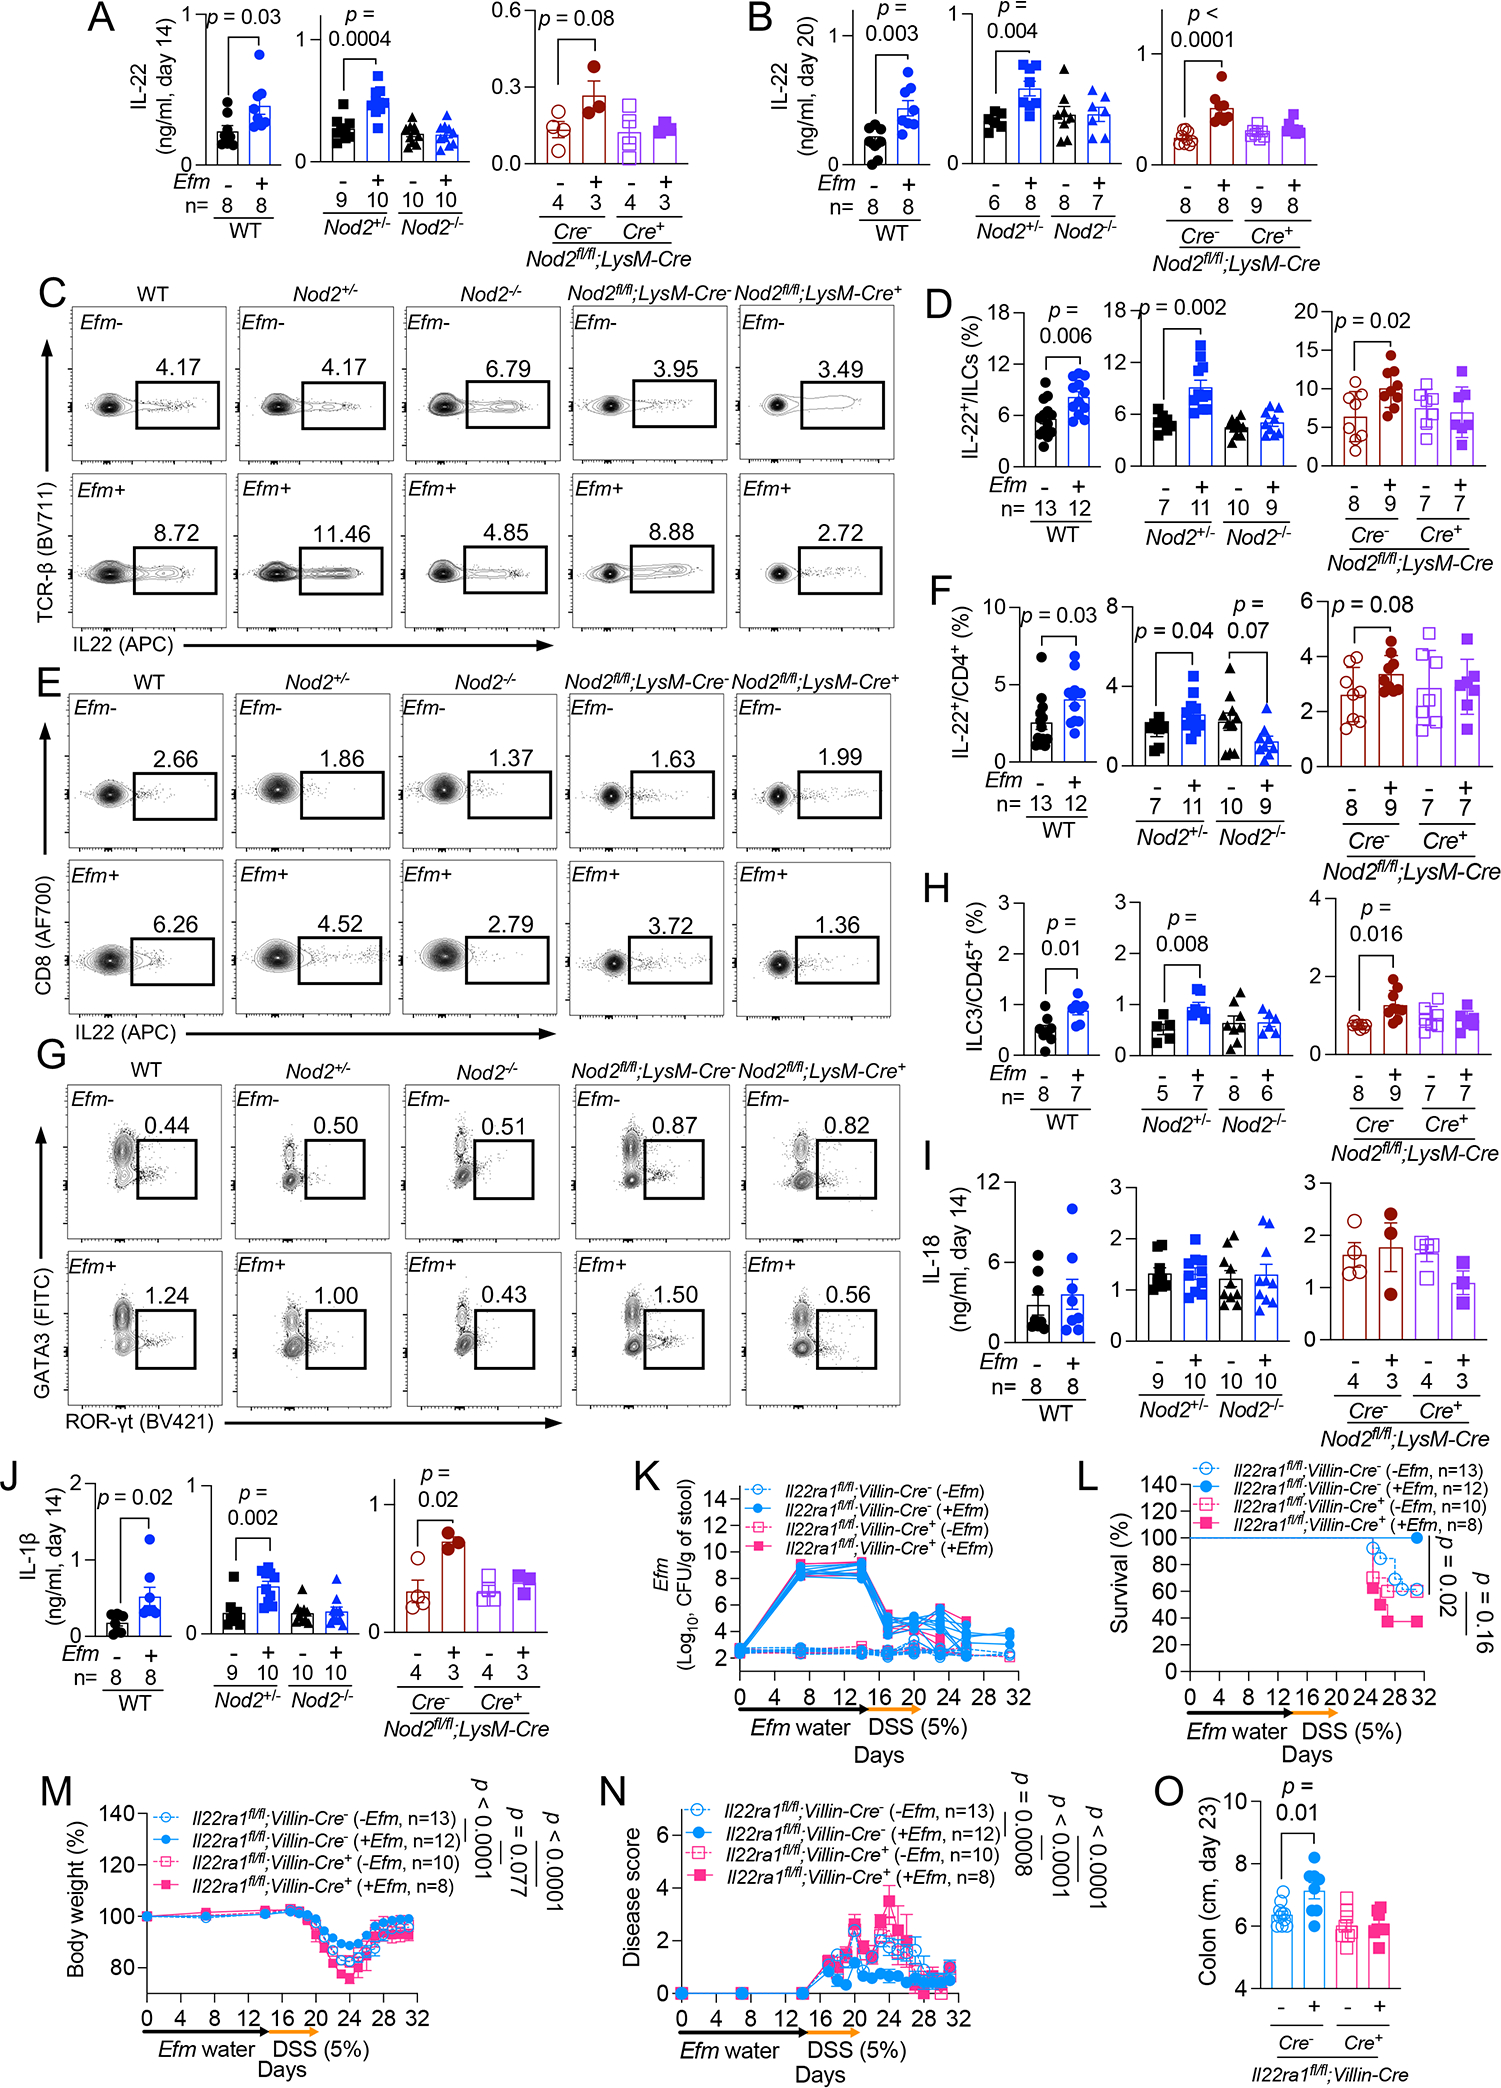
Figure 6. IL-1β induced by Efm protective IL-22-producing lymphoid cells.

A and B) Quantification of IL-22 on days 14 (A) and 20 (B) in gut explants from WT, Nod2+/−, Nod2−/−, and Nod2fl/fl;LysM-Cre− and Cre+ mice ± Efm inoculation. C-F) Representative flow cytometry plots and quantification of proportion of colonic IL-22+ innate lymphoid cells (ILCs) (C and D) and CD4+ T cells (E and F) in indicated mice ± Efm inoculation. G and H) Representative flow cytometry plots and quantification of group 3 ILCs (ILC3s) from mice in C-F. I and J) Quantification of IL-18 (I) and IL-1β (J) in gut explants from A. K-O) DSS treatment of Il22ra1fl/fl;Villin-Cre− and Cre+ mice following administration of Efm or control examined for Efm burden in the stool (K), survival (L), changes in body weight (M), disease score (N), and colon length on day 23 (O). Data points in A, B, D, F, H-J, and O and lines in K represent individual mice. Data points in M and N represent mean ± SEM. Bars represent mean ± SEM and at least two independent experiments were performed. Indicated p values by unpaired t test, two-tailed in A, B, D, F, H, J, and O, log-rank Mantel-Cox test in L, and two-way ANOVA test in M and N. See also Figures S5 and S6.
