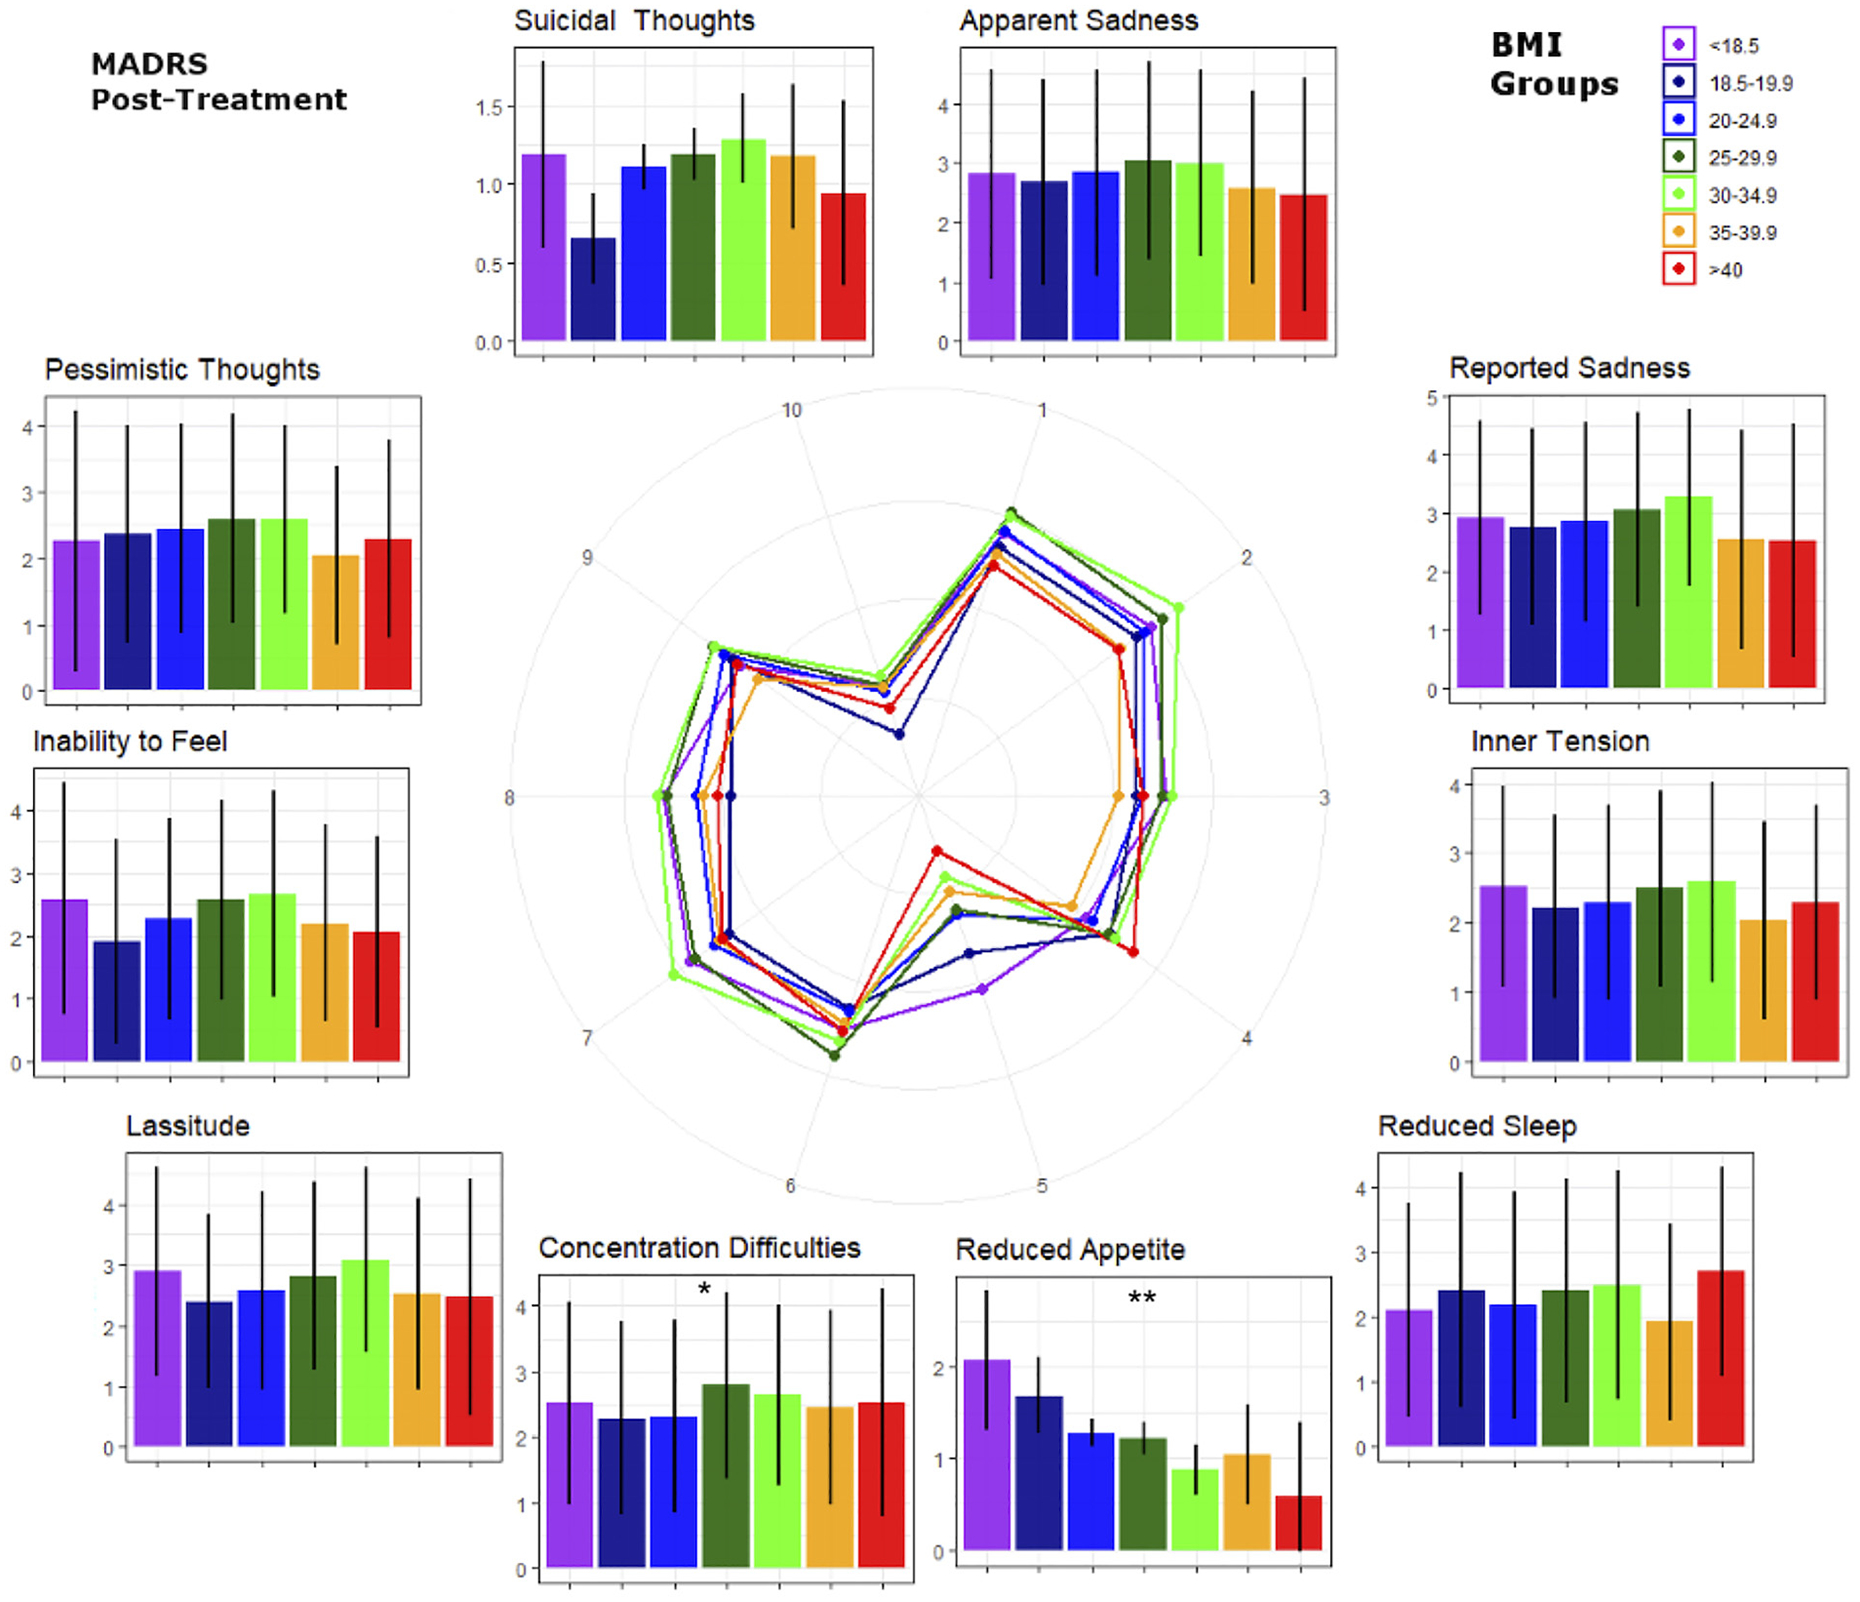
Fig. 3.

Post-treatment Montgomery–Åsberg Depression Rating Scale (MADRS) sub-item scores by body mass index (BMI) groups (i.e., post-treatment BMI values). BMI groups correspond to those in Fig. 1. Numbers in the spider graph represent MADRS subitem scales from 0 to 6. Note differences from baseline values in the ‘lassitude’ and ‘suicidal thoughts’ items. *p < 0.05 uncorrected, **Bonferroni corrected p-values.
