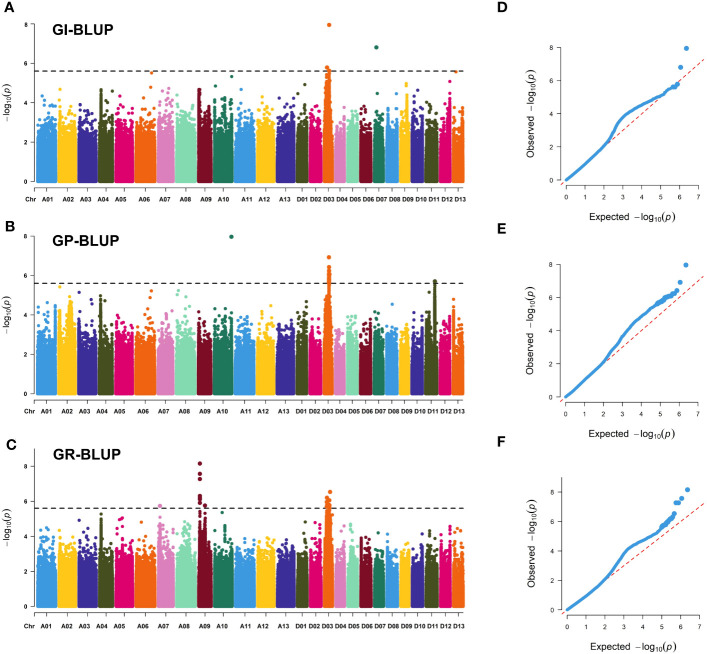
Figure 3.
Genome-wide association study results for seed vigor-related traits. (A–C) Manhattan plots of GI-BLUP, GP-BLUP, and GR-BLUP for single-nucleotide polymorphism (SNP) markers, respectively. Significant SNP markers are distinguished by black lines. (D–F) QQ plots for GI-BLUP, GP-BLUP, and GR-BLUP, respectively.

