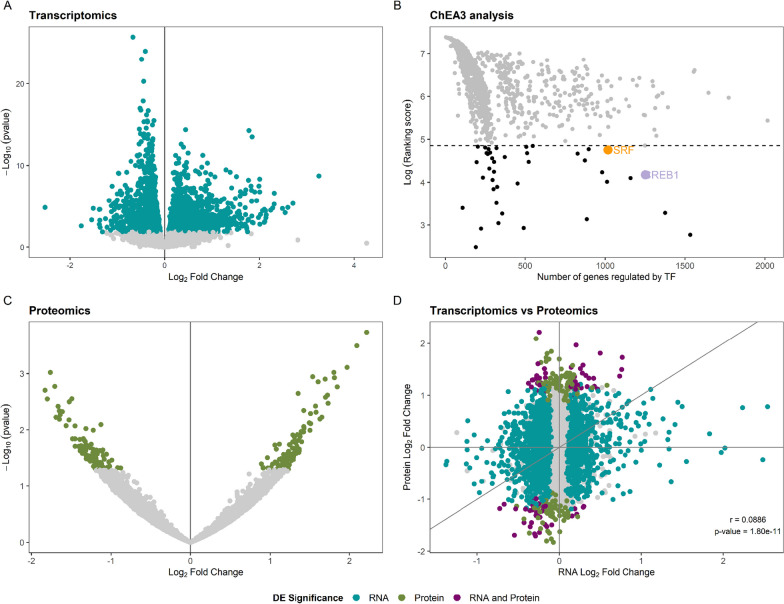
Fig. 2.
Summary of the results of the RTT-MECP2 versus healthy controls analysis. A RNAseq DE analysis results. The coloured genes are considered differentially expressed, passing a threshold of BH < 0.05. B Upstream TF ChEA3 analysis for the DEGs. The 40 TFs that were further studied are coloured in black. C Proteomics DE analysis results. The coloured proteins are considered differentially expressed, passing a threshold of nominal p value < 0.05. D) An integrated view of the transcriptomics and proteomics results. The genes that are significant at both analyses are coloured in purple

